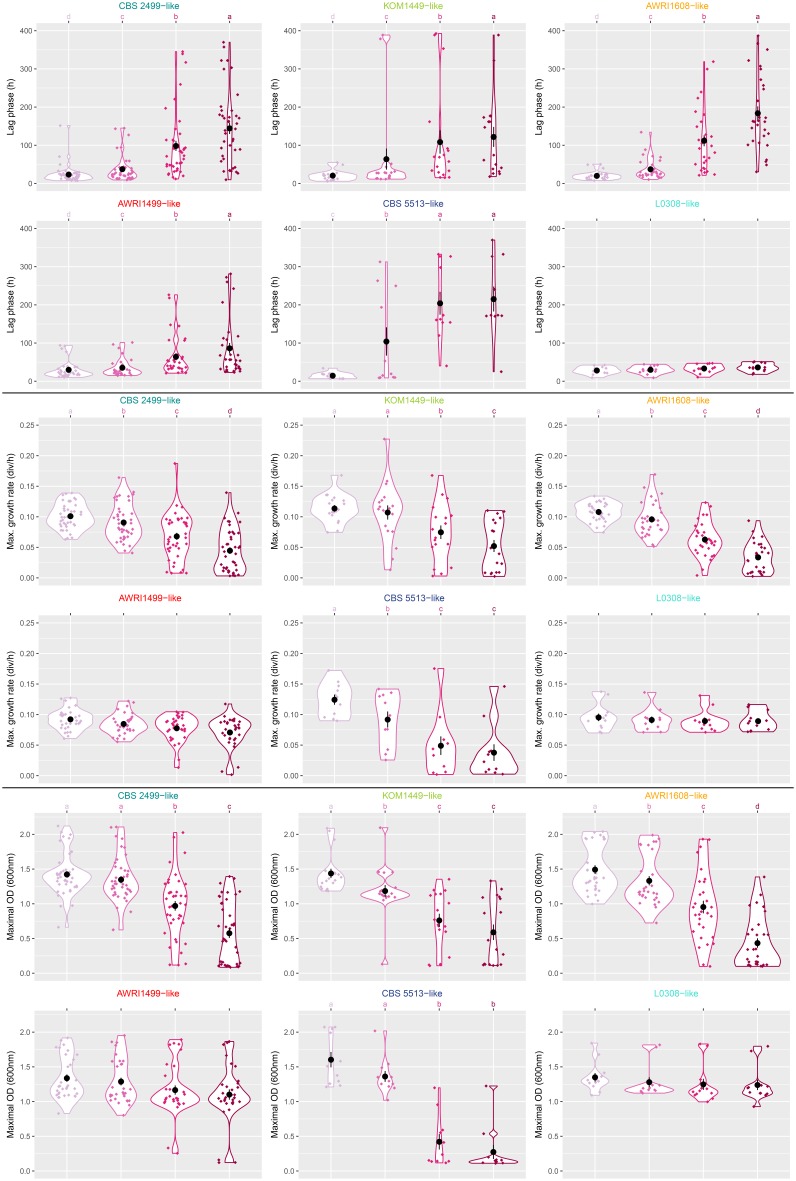
FIGURE 3.
Violin plots for three growth parameters and six genetic groups of B. bruxellensis. Three growth parameters were represented: lag phase (h), maximum growth rate (division per hour), and maximum OD (600 nm). For each genetic group, numeric values (corresponding to the different strains) are represented as diamonds, the corresponding probability densities are represented as plain traits, means, and standard errors are represented by black circles and segments, respectively. Increasing SO2 concentrations are represented by the same coloring (pink shades, light pink corresponding to 0 mg/L and darker color representing increasing SO2 concentrations) as in Figure 2. The plots were obtained using ggplot2 package (R). Top letters represent significance groups as defined by Kruskal–Wallis test (agricolae package, p-value < 0.05). Absence of top letters indicates non-significantly different sulfur conditions.

