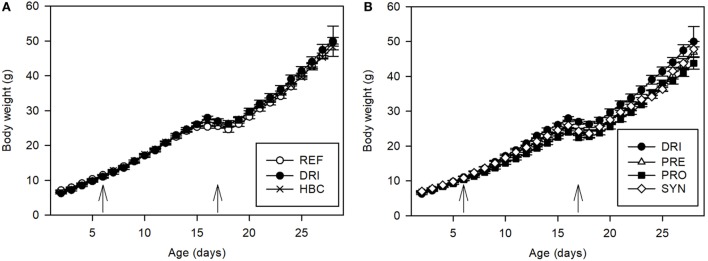
Figure 1.
Body weight (g) during the study, before, and after the virus inoculations (indicated by arrows) on day 6 and day 17 (A) for REF, DRI, and HBC groups; (B) for DRI, PRE, PRO, and SYN groups. Results are expressed as mean values ± SEM. Statistical significance is explained in the text (n = 12–21 animals/group). Groups: REF, reference; DRI, double rotavirus infected; HBC, hyperimmune bovine colostrum; PRE, prebiotic; PRO, probiotic; SYN, synbiotic.

