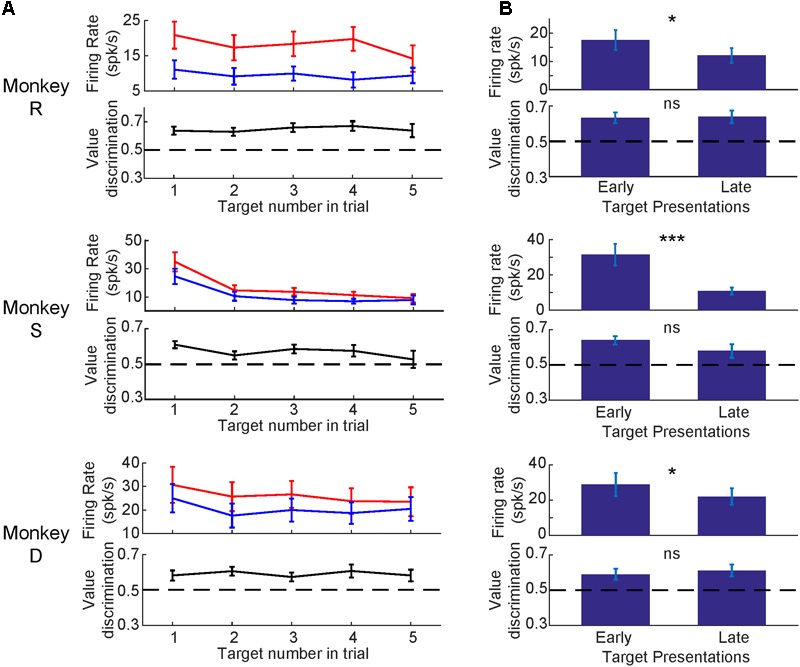
FIGURE 6.

Visual response diminished for later object presentations while value-modulation remained. (A) Average neuronal responses at 1st, 2nd, 3rd, 4th, or 5th presentation of objects in each trial. Top: firing rates (mean and SEM) for good objects (red) and bad objects (blue). Bottom: value-modulation measured by value discrimination score (with SEM). (B) Comparison between the early (1st) or late (4th and 5th) object presentations. Error bars: SEM. ∗p < 0.05, ∗∗∗p < 0.001, ns: non-significant.
