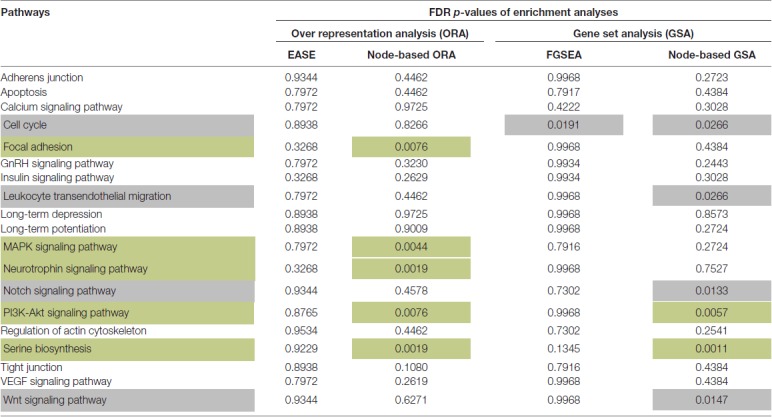
Table 1.
The enrichment of signaling pathways with genes that have increased variances in Schizophrenia (SCZ) samples.
 |
FDR p-values of four enrichment analyses (two ORA and two GSA) is presented. Green color marks pathways, which were significantly enriched (FDR p-value < 0.01) for genes with increased expression variance in at least one analysis. Gray color marks pathways, which were not significantly enriched, but demonstrated FDR p-values < 0.05.
