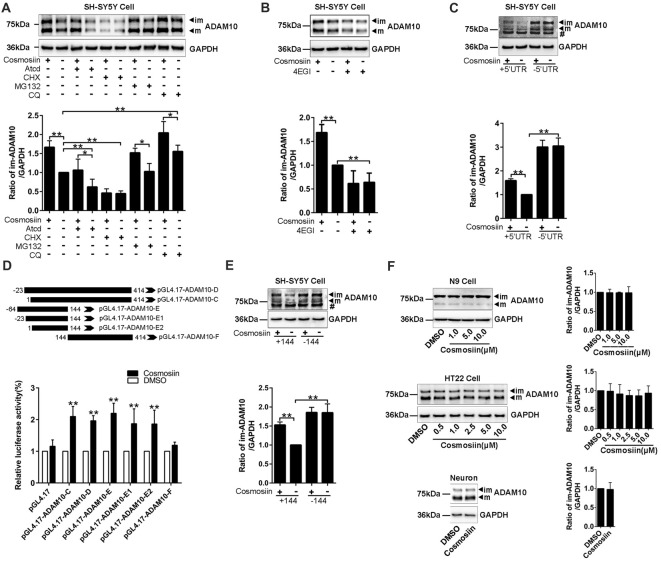
Figure 2.
Cosmosiin regulation of ADAM10 involves the first 144 nucleotides of 5’-untranslated region (5’UTR). (A) Representative Western blots (top) and bar plot summary (bottom) of ADAM10 levels in SH-SY5Y cells treated with cosmosiin (5 μM, 36 h) or DMSO (1:10,000), in the absence or presence of transcription inhibitor actinomycin D (ActD, 0.1 μM for 12 h), translation inhibitor cycloheximide (CHX, 5 μM for 6 h), proteasome inhibitor MG132 (1 μM for 6 h), or lysosome inhibitor chloroquine (CQ, 100 μM for 6 h). (B) Representative Western blots (top) and bar plot summary (bottom) of ADAM10 levels in SH-SY5Y cells treated with cosmosiin (5 μM) in the absence or presence of 4EGI1 (25 μM, 6 h). (C) The levels of ADAM10 protein in SH-SY5Y cells transiently transfected with truncated human ADAM10 with deleted 5’UTR (−5’UTR) or with the entire human ADAM10 containing 5’UTR (+5’UTR). ADAM10 levels are significantly reduced in cells containing +5’UTR relative to those in cells with −5’UTR. In −5’UTR transfected cells, there is no significant difference in the levels of ADAM10 between cosmosiin- and control-treated cells. # indicates a nonspecific band. (D) Top: The 5’UTR of ADAM10 was truncated into different fragments and subcloned into a pGL4.17 vector to construct the luciferase reporter plasmids: pGL4.17-ADAM10-C, pGL4.17-ADAM10-D, pGL4.17-ADAM10-E, pGL4.17-ADAM10-E1, pGL4.17-ADAM10-E2 and pGL4.17-ADAM10-F. Numbers indicate the relative positions with respect to nucleotides in the 5’UTR. Bottom: relative luciferase activities in SH-SY5Y cells transiently transfected with different pGL4.17ADAM10 plasmids and treated with 5 μM cosmosiin for 36 h. The measured activity of firefly luciferase normalized to the luciferase activity of the internal control plasmid pGL4.17. (E) Representative Western blots (top) and bar plot summary (bottom) of 6× His tagged ADAM10 in SH-SY5Y cells transiently transfected with truncated human ADAM10 with the first 144 nucleotides of 5’UTR deleted (−144) or with the entire human ADAM10 containing full-length 5’UTR (+144). # indicates a nonspecific band. (F) Representative Western blots (left) and bar plot summary (right) of ADAM10 protein levels in N9 cells (top), HT22 cells (middle) and primary hippocampal neurons (bottom), treated with cosmosiin at different concentrations or treated with the vehicle DMSO (1:10,000) for 36 h. Data are expressed as means ± SD. *P < 0.05; **P < 0.01 (n = 3–5).

