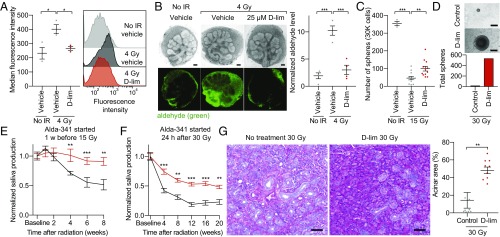
Fig. 3.
d-limonene reduces aldehyde levels after IR and mitigates IR-induced hyposalivation in vivo. (A, Left) Aldehyde levels in dissociated salispheres 2 h after IR treated with 100 μM d-limonene or vehicle (PEG-400) control, measured as median fluorescence intensity of DarkZone dye. (Right) Representative histograms of the fluorescence intensity of 10,000 cells (n = 3; bars indicate SEM; *P < 0.05). (B, Left) Representative images of E13.5 SMGs cultured for 24 h with 25 μM d-limonene or vehicle (PEG-400) control, incubated with DarkZone dye, and imaged 3 h after IR with brightfield (Upper Row) and a fluorescence filter (Lower Row). (Scale bars: 100 μm.) (Right) Quantified aldehyde levels measured as average fluorescence intensity per gland area and normalized to nonirradiated vehicle control (n = 4; bars indicate SEM; ***P < 0.001). (C) Number of spheres grown from 30,000 dissociated SMG cells from mice 24 h after a single dose of 15 Gy. The treatment group received daily d-limonene in chow starting 7 d before IR. (no IR control: n = 3; IR groups: n = 12; bars indicate SEM; **P < 0.01; ***P < 0.001.) (D, Upper) Representative images of spheres grown from dissociated SMG cells from mice 20 wk after 30-Gy IR (6 Gy/d). The treatment group received daily d-limonene starting 24 h after IR. (Scale bars: 50 μm.) (Lower) Total number of spheres counted from each group (n = 4 SMGs per group). (E) Saliva was measured in female C57BL/6J mice at baseline and 1, 2, 4, 6, and 8 wk after a single dose of 15 Gy. The treatment group started daily 10% d-limonene 7 d before IR (n = 7–8; bars indicate SEM; **P < 0.01; ***P < 0.001). (F) Saliva was measured in female C57BL/6J mice at baseline and every 4 wk after 30-Gy IR (6 Gy/d). The treatment group started daily 10% d-limonene 24 h after the final IR fraction. (n = 7–8; bars indicate SEM; **P < 0.01; ***P < 0.001). (G, Left) Representative images of mouse SMGs 20 wk after IR, stained with PAS. (Scale bars: 50 μm.) (Right) Quantification of the SMG acinar area 20 wk after IR using 10 random images per group (n = 6–14 SMGs; bars indicate SEM, **P < 0.01).

