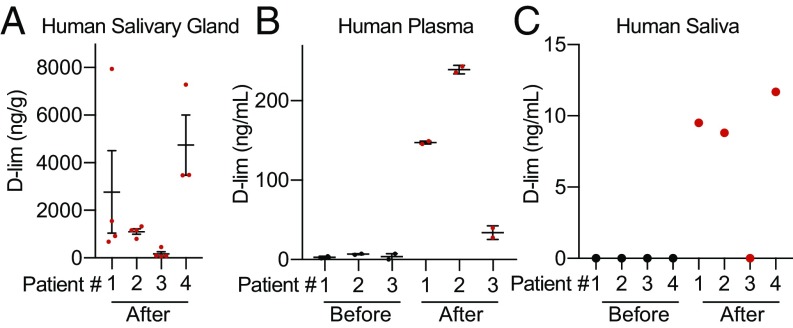
Fig. 5.
Phase 0 human study of d-limonene drug distribution in four patients. (A) d-limonene levels in human salivary gland tissue collected after 2 wk of 2 g/d oral d-limonene measured by GC-MS (n = 4 tissue samples per patient; bars indicate SEM). (B) d-limonene levels in human plasma measured by GC-MS at baseline and after 2 wk of d-limonene treatment (n = 2 samples per patient per time point; the fourth patient was unable to provide plasma). (C) d-limonene levels in human saliva were measured by GC-MS at baseline and after 2 wk of d-limonene treatment (n = 1 sample per patient per time point).

