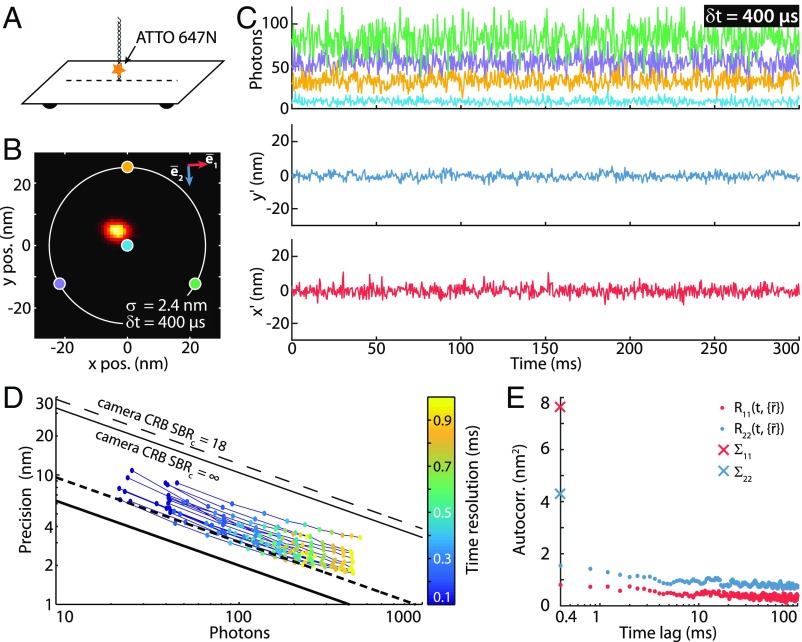
Fig. 2.
Fluorescence time traces of a single molecule and resulting localization precision at high temporal resolution using MINFLUX. (A) Diagram of the DNA origami construct with a single ATTO 647N fluorophore attached closely to a glass surface. Immobilization was achieved by complementarily pairing a ssDNA linked to an ATTO 647N molecule with a second ssDNA that is attached to a rectangular DNA origami (SI Appendix, Sample Preparation). (B) Histogram of 13,625 MINFLUX localizations of a sample with 1 × 1-nm binning. Time resolution, µs; localization precision, nm; average counts, photons. The positions of the doughnut zeros are marked as colored dots with a parameter nm. The axis (blue arrow) indicates the direction of maximal emitter movement; the red arrow is perpendicular to it (SI Appendix, Autocorrelation Analysis). (C, Upper) A 300-ms excerpt of the detected photon count trace (time resolution of µs per localization). The color coding corresponds to the targeted coordinates shown in B. (C, Lower) Estimated mean-subtracted trajectory (rotated coordinate system: , ). (D) Colored dots: experimental MINFLUX localization precision as a function of the number of photons for emitters within a ROI of dROI = 30 nm. The color coding indicates the time resolution of the measurement. The MINFLUX CRB at the center of the targeted coordinates set (thick black line), the average CRB at the edge of the ROI (thick dashed line), and the ideal camera CRB (thin black lines) are included. (E) Autocorrelation analysis of the trajectory along the principal axes detailed in B with a time resolution of µs. along axis . : along axis . and (crosses) are the variances along these two directions.

