Fig. 3.
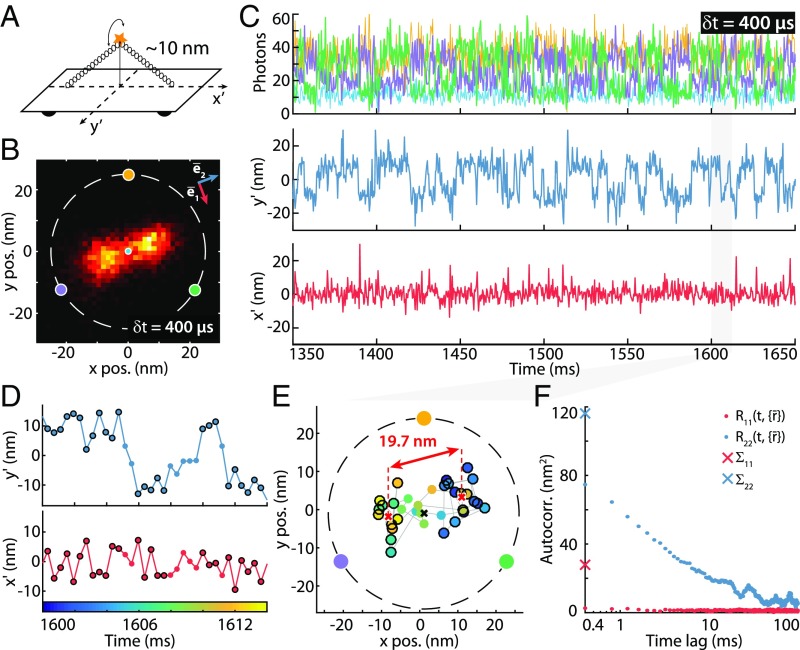
MINFLUX tracking of rapid movements of a custom-designed DNA origami. (A) Diagram of the DNA origami construct with a single ATTO 647N fluorophore attached at the center of the bridge ( nm from the origami base). By design, the emitter can move on a half-circle above the origami and is thus ideally restricted to a 1D movement. (B) Histogram of 6,118 localizations of the sample in A with δt = 400-µs time resolution and a 1.5 × 1.5-nm binning. The predominant motion is along a single direction (). (C, Upper) A 300-ms excerpt of the photon count trace (time resolution δt = 400 µs per localization). The color coding corresponds to the zero positions shown in B. (C, Lower) Mean-subtracted trajectory (rotated coordinate system: , ). (D) Excerpt of 14-ms duration of the trace shown in C containing 35 localizations, highlighting the predominant and rather stationary positions (black circles). Transitions between these predominant positions are clearly resolved. (E) Scatter plot of the excerpt shown in D. The color coding of the dots indicates the time (same color bar as in D). The distance of black encircled data points (also marked in D) is displayed. (F) Autocorrelation analysis of the trajectory along the principal axes detailed in B. : along principal axis . along secondary axis . and (crosses) are the variances along these two directions. The estimated SD of the emitter movement along these directions are nm and nm (with a relaxation half-time of 2.1 ms; SI Appendix, Autocorrelation Analysis).

