Fig. 2.
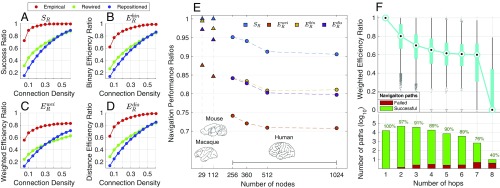
Navigability of mammalian connectomes. (A–D) Success ratio (), binary efficiency ratio (), weighted efficiency ratio (), and distance efficiency ratio () for human connectomes () at several connection density thresholds. Empirical measures (red) for group-averaged connectomes were compared with 1,000 rewired (green) and spatially repositioned (blue) null networks. Shading indicates 95% confidence intervals. (E) The same performance metrics shown across different parcellation resolutions of mammalian structural networks ( shown in blue, in orange, in yellow, and in purple). Triangles denote nonhuman species while circles denote human data. Dashed lines denote the same connection density (15%) across all human networks. (F) Navigability stratified by hop count ( at 15% connection density). Blue box plots indicate the quartiles of navigation paths benchmarked against shortest paths with matching hop count. Bar plots show the number of shortest paths for a given hop count, with colors indicating the proportion of successful (green) and failed (red) navigation paths. Brain diagrams reproduced from ref. 9, with permission from Elsevier.

