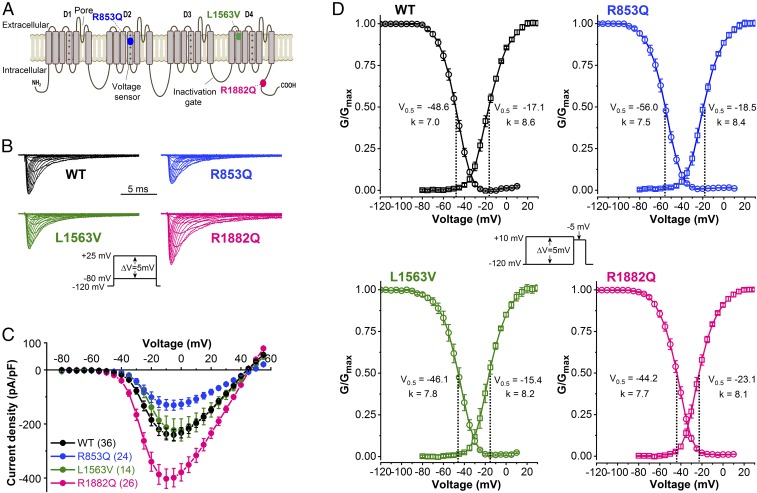
Fig. 1.
Location of Nav1.2 mutations and biophysical properties of wild-type (WT), R853Q, L1563V, and R1882Q channels. (A) Predicted transmembrane topology of Nav1.2 channels denoting the R853Q and R1882Q mutations associated with later-onset and early-onset DEE respectively, and the L1563V mutation associated with BFNIS. Domains D1−D4 are indicated; note the positive charges on the voltage sensor (fourth segment) of each domain. (B) Representative wild-type and mutant INa traces, elicited by 20-ms depolarizing voltage steps of 5-mV increment from a HP of −120 mV (Inset voltage protocol). (C) Current–voltage relationships. (D) Voltage dependence of activation (squares) and inactivation (circles). The normalized conductance–voltage relationships are plotted as G/Gmax values versus voltage and are referred to as “activation” curves. Curves were obtained by nonlinear least-squares fits of Boltzmann equations (Materials and Methods). Values of fitted parameters are indicated below each curve and summarized in Table 2. Activation was assessed using the voltage protocol described in B. Inactivation was determined from a HP of −120 mV using 100-ms conditioning steps ranging from −120 to +10 mV followed by 20-ms test pulses to −5 mV (Inset), at 0.1 Hz. The number of experiments, n, are shown in Table 2.

