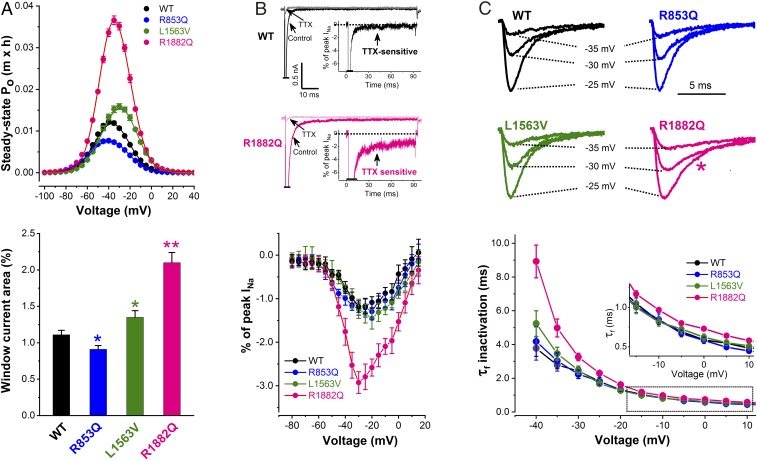
Fig. 2.
Mechanisms contributing to sodium channel dysfunction in R853Q, L1563V, and R1882Q channels. (A) Voltage dependence of the steady-state open probability (Po) (Upper). The m × h product was calculated for every cell using the individual G/Gmax values described in Fig. 1D, and plotted against the Vm. (Lower) Mean percentages of window current relative to total current in wild-type (WT) and mutant Nav1.2 channels. Data are represented as mean ± SEM (n, same as in Fig. 1D) (see data with statistics in Table 2). *P < 0.05, **P < 0.01. (B) Demonstration of persistent inward INa. (Upper) Sensitivity of persistent inward INa to tetrodotoxin (TTX). Peak currents are off scale. Insets show TTX sensitive current as percentage of peak INa, obtained by subtraction. (Lower) Mean current–voltage relationships of persistent INa expressed as percentage of peak INa for wild-type (n = 30), R853Q (n = 21), L1563V (n = 14), and R1882Q (n = 25). Dotted lines indicate zero current level. (C) Typical wild-type and mutant INa traces elicited at −25, −30, and −35 mV (Upper). Note the slower inactivation time course of R1882Q INa vs. wild-type (pink star). (Lower) Average fast time constants (τf) of INa inactivation plotted against test potential. (Inset) Boxed τf values on an expanded scale. R1882Q channels show larger τf values versus wild-type (see data with statistics in Table 2).

