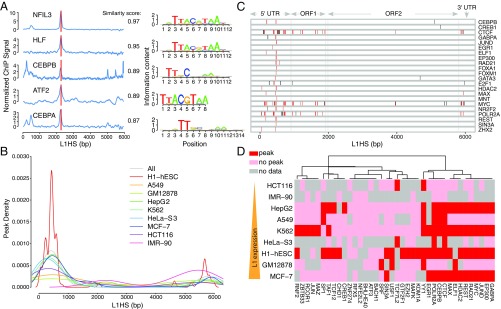
Fig. 2.
Landscape of L1-interacting TFs. (A) We identified a group of TFs (bZIPs) enriched at the beginning of ORF2. Blue lines show the ChIP profiles of each TF in HepG2 cells, and the vertical red bar indicates the location of known motifs; logos are shown on the Right. (B) Peak enrichment of each cell line is made by combining all the TF peaks called from each dataset of that cell line, and the distribution is generated using the kernel function. (C) All the binding TFs in MCF-7 cells are plotted along the L1HS DNA sequence. Red bars indicate a peak location that has been identified repeatedly for multiple TFs in our analysis; black bars indicate unique peak locations for a specific TF. (D) Heatmap of selected TFs in nine commonly used ENCODE cell lines. The cell lines are sorted based on their relative L1 expression level from RNA-seq, and the color indicates whether each TF has binding peaks in the L1 promoter. The TFs are ordered by calculating the Euclidean distance and are hierarchically clustered using Ward’s method. It is clear that TF binding to the 5′ UTR promoter is not highly correlated with the L1 expression level.

