Fig. 3.
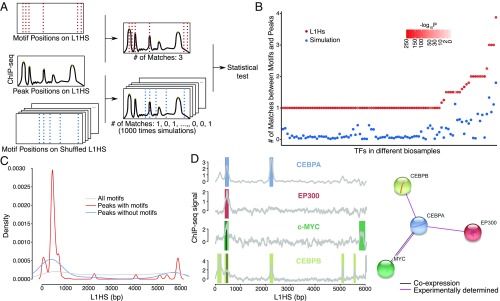
Motifs underlying TF-binding peaks. (A) To test whether the match of motif and TF peaks from ChIP-seq is significantly different from random, we performed simulation by shuffling the L1HS sequence 1,000 times and looked for motifs in those shuffled sequences. The number of matches between motif and peak location was counted and compared with the number of true matches (number of matches between the unshuffled L1HS sequence and ChIP-seq peaks). P values were calculated using the Wilcoxon one-sample signed rank test. (B) The number of true matches (red dots) and simulated matches (blue dots) are plotted for each TF–cell line pair. The simulated matches are averaged, and P values are indicated by the intensity of redness. (C) The distribution of motifs and peaks is plotted along the L1HS sequence. The ChIP-seq peaks are categorized into two groups based on whether the specific TF motifs can be found at the peak locations. (D, Left) A small network of four physically interacting TFs colocalizes at the L1 promoter. Two motifs, c-Myc and CEBPB (black lines), are found under peaks. Color bars indicate the peak locations for each TF, and gray lines show the ChIP profiles. (Right) The scheme was generated by STRING database v10.5.

