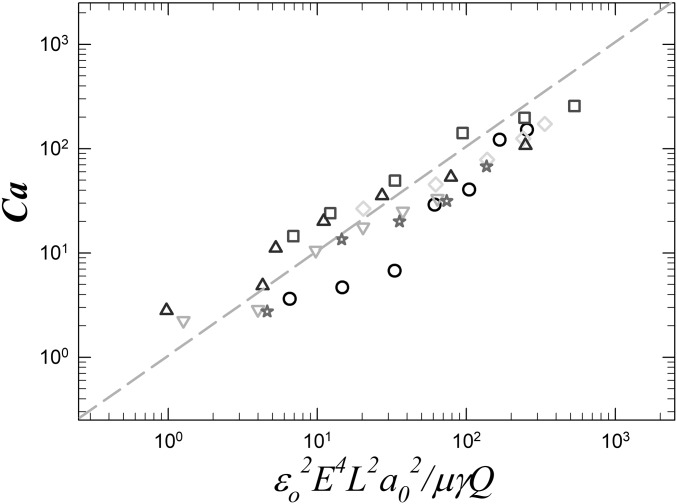
Fig. 5.
A log−log plot of the capillary number versus for the transition to coiling. The grayscale symbols correspond to different experimental parameters: circles (○) (L = 11.4 mm, Q = 30 mL/h, = 0.92 mm, = 32 mN/m); triangles-down (▿) (L = 12.7 mm, Q = 40 mL/h, = 0.92 mm, = 32 mN/m); squares (□) (L = 8.2 mm, Q = 1 mL/h, = 0.92 mm, = 2 mN/m); diamonds (◇) (L = 9.6 mm, Q = 0.5 mL/h, = 0.92 mm, = 2 mN/m); triangles-up (▵) (L = 12.8 mm, Q = 10 mL/h, = 0.92 mm, = 32 mN/m); and stars (☆) (L = 7.4 mm, Q = 8 mL/h, = 0.46 mm, = 32 mN/m).The data points from the same symbols correspond to different applied electric field strengths. All symbols collapse onto a dashed line representing a linear relationship, confirming our scaling relationship as stated in Eq. 4.

