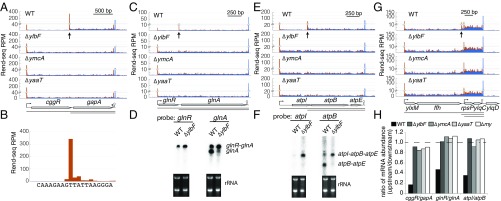
Fig. 1.
Absence of short polycistronic mRNA isoforms in B. subtilis lacking components of the Y-complex. Rend-seq data show 5′-mapped (orange) and 3′-mapped (blue) read counts plotted for the cggR-gapA (A), glnR-glnA (C), atpI-atpB-atpE (E), and ylxM-ffh-rpsP-ylqD (G) regions of the B. subtilis genome from wild-type (WT) cells (strain 3610, ∆epsH background) and mutants lacking ylbF, ymcA, and yaaT, respectively. Horizontal lines below the gene annotations indicate potential isoforms predicted by Rend-seq for WT cells. Longer isoforms due to partial read-through of transcription terminators after gapA, atpE, and ylqD are not depicted. Vertical arrows point to positions of the 5′ ends of isoforms that disappear in mutants lacking components of the Y-complex. Peak shadows are removed from Rend-seq data (SI Appendix, Extended Materials and Methods) (37). For each position, the number of reads mapped is normalized by the number of million reads for that sequencing sample that align to the B. subtilis genome outside of rRNA and tRNAs. (B) Rend-seq 5′-mapped reads surrounding the 5′ end of the gapA-only isoform (±10 nt) in WT cells, with the base corresponding to each position below. Northern blot analysis shows the identity of operonic mRNA isoforms in WT cells and a mutant lacking YlbF for the glnR-glnA (D) and atpI-atpB (F) operons, with rRNA used as a loading control. The 5′ ends predicted for the ylxM-ffh-rpsP-ylqD operon were previously verified by 5′ RACE (37). (H) Ratio of mRNA levels between neighboring genes at either side of Y-complex–dependent 5′ ends. The mRNA levels are quantified using Rend-seq. RPM, reads per million.

