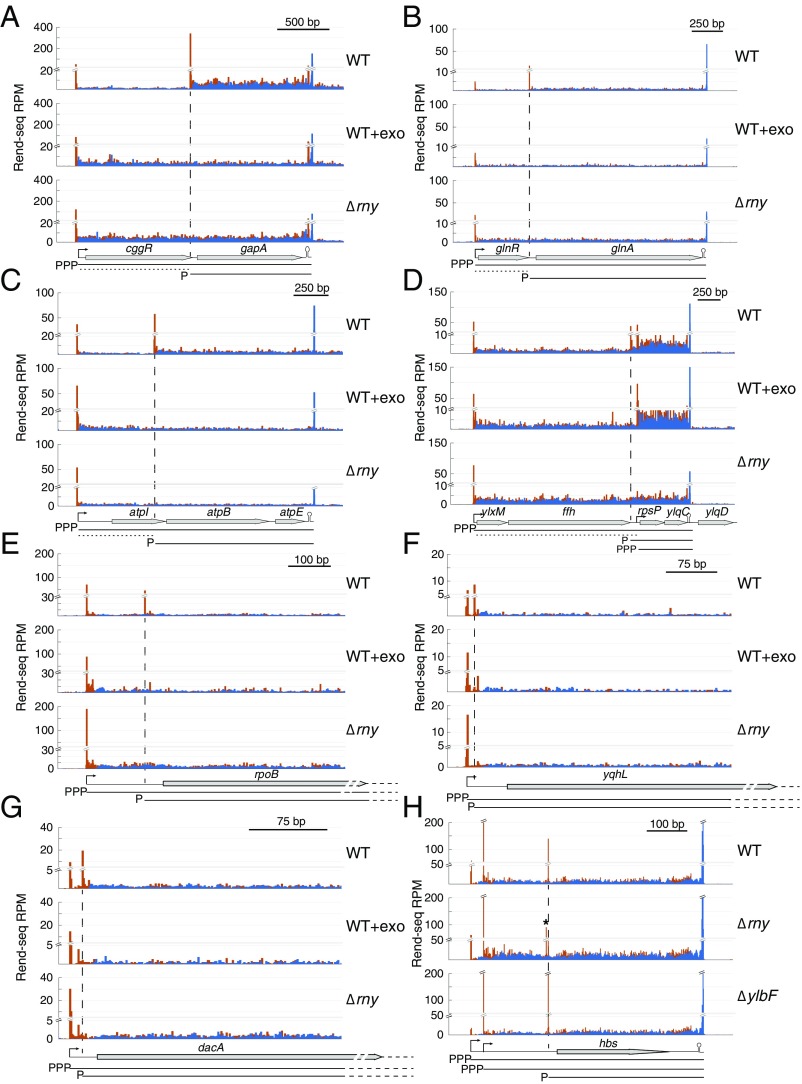
Fig. 3.
RNase Y cleavage generates the truncated mRNA isoforms. (A–G) Rend-seq 5′-mapped (orange) and 3′-mapped (blue) read counts plotted for the cggR-gapA, glnR-glnA, atpI-atpB-atpE, ylxM-ffh-rpsP-ylqD, rpoB, yqhL, and dacA regions of the B. subtilis genome. For each region, Rend-seq data are shown for RNA extracted from wild-type (WT) cells (strain 3610, ∆epsH background), WT cells treated with a 5′-exo (WT+exo) (strain 168 background), and a mutant lacking RNase Y (Δrny). Horizontal lines below the gene annotations indicate potential isoforms predicted by Rend-seq for WT cells, with the 5′ moiety marked. Horizontal dashed lines indicate potential cleavage products that are rapidly degraded. Longer isoforms due to partial read-through of transcription terminators after gapA, atpE, and ylqD are not depicted. For rpoB and dacA, transcription continues past the regions shown into downstream genes. Vertical dashed lines indicate positions of the 5′ ends of the truncated isoforms that are absent in the mutant of RNase Y and are sensitive to 5′-exo treatment in vitro. Peak shadows are removed from Rend-seq data (SI Appendix, Extended Materials and Methods). (H) Rend-seq data plotted for the hbs region of the B. subtilis genome for RNA extracted from WT cells and mutants lacking RNase Y (Δrny) or a component of the Y-complex (ΔylbF). The asterisk indicates an alternative 5′ end that appears in the mutant of RNase Y, which is consistent with the isoform labeled as “M + 4” in the study by Braun et al. (14). P, monophosphate; PPP, triphosphate; RPM, reads per million.

