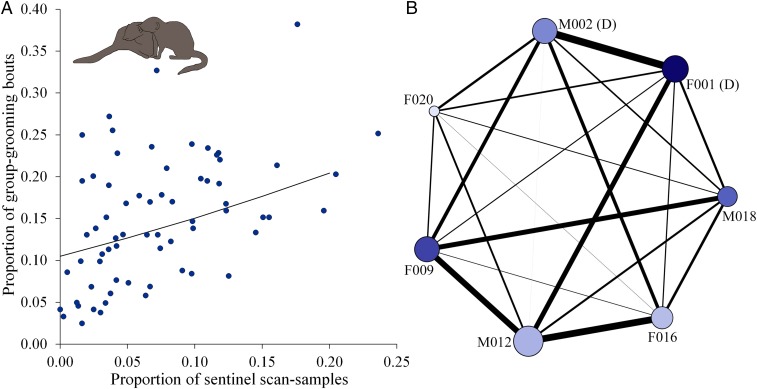
Fig. 1.
Relationship between natural contributions to sentinel behavior and receipt of grooming. (A) Individuals who contributed more to sentinel behavior were involved in more grooming interactions. Each point represents one individual. Line shows predicted effects from the LMM in SI Appendix, Table S2b (N = 49 individuals, 10 groups). (B) An example group’s grooming network. Node size is proportional to normalized weighted degree, node color intensity is proportional to sentinel contribution, and line thickness between individuals is proportional to the strength of the dyadic grooming association. (D) denotes the dominant pair, and ID codes denote females (F) and males (M). Network diagrams were constructed using Gephi 0.9 (42).

