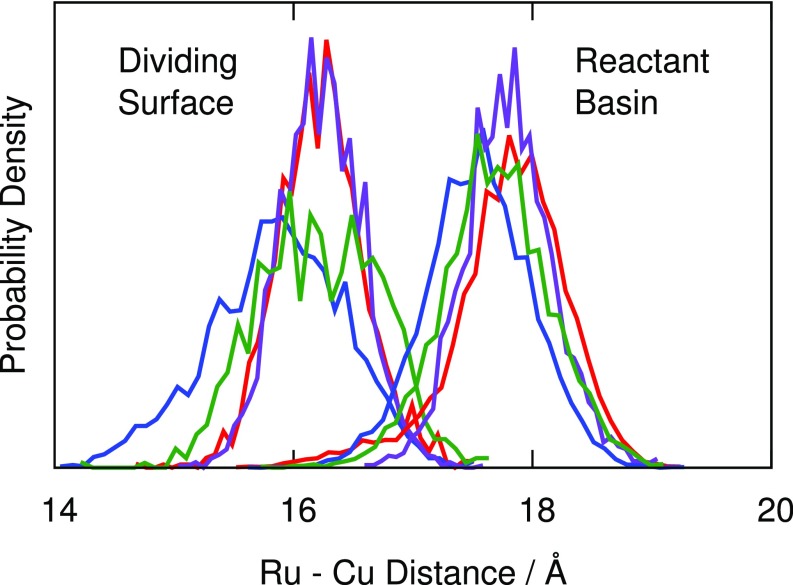
Fig. 2.
Histogram of the Ru–Cu distance generated using KC-RPMD in the reactant basin and at the dividing surface for WT (red), N47D (purple), N47S (green), and N47L (blue). The dividing surface shows a clear compression of the Ru–Cu distance for WT and all mutants, with N47L showing the strongest degree of compression leading to an increased electronic coupling.

