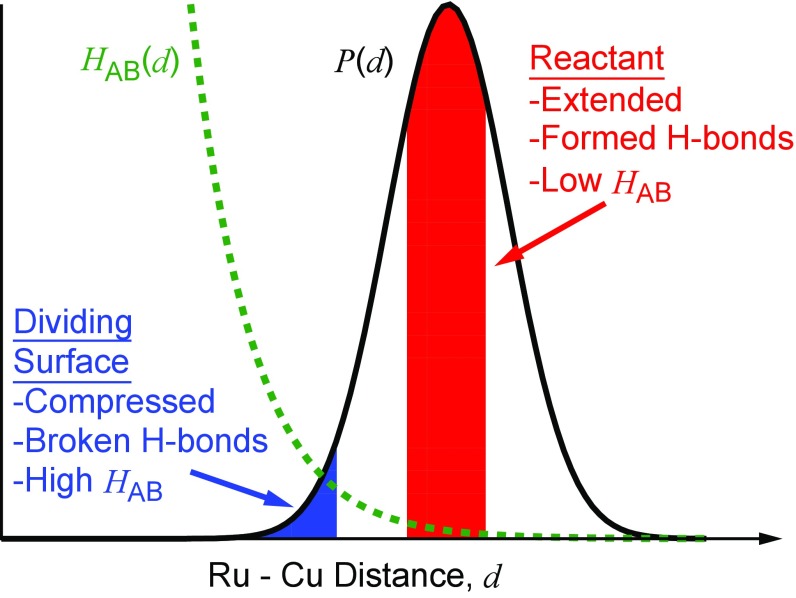
Fig. 6.
Schematic illustration of the atomistic features governing ET in WT azurin. The black curve corresponds to the probability distribution, , of Ru–Cu distances, , while the green-dashed curve corresponds to the distance-dependent electronic coupling, . Reactant basin and dividing surface configurations are indicated in red and blue, respectively.

