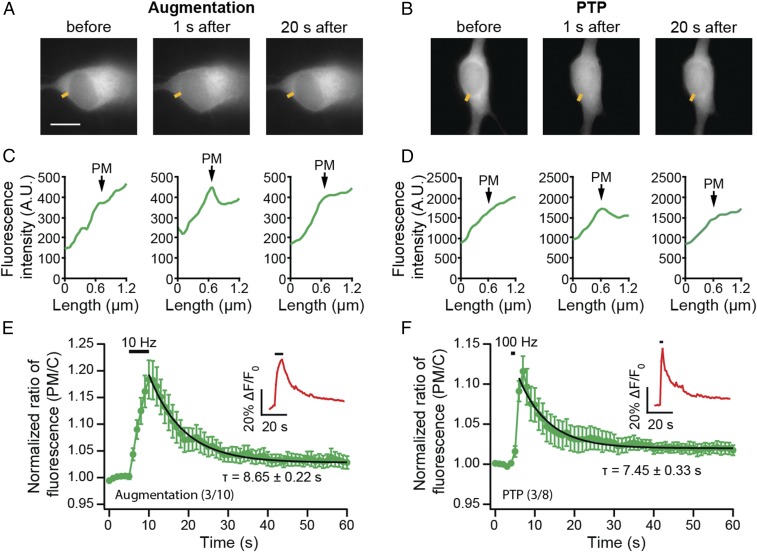
Fig. 3.
Doc2 dwell time at the plasma membrane coincides with the duration of augmentation. (A and B) Sample images from neurons stimulated using augmentation (10 Hz, 5 s; A) or PTP (100 Hz, 1 s; B) protocols. (Scale bar: 10 μm.) Doc2β-GFP translocated to the plasma membrane upon stimulation; after the stimulus train, it retreated back to the cytosol in a time-dependent manner. (C and D) Under these conditions, low levels of translocation were observed, so representative line scans of Doc2β-GFP fluorescence (yellow line segments in A and B) are shown; the position of the PM in the line-scan data is indicated. (E and F) Translocation of Doc2-GFP was quantified using normalized fluorescence intensity ratios (plasma membrane/cytosol), as detailed in SI Appendix, Fig. S3. To ensure successful activation of neurons, [Ca2+]i was monitored during the experiment using X-Rhod-1 AM (averaged trace of normalized fluorescence intensity shown in Insets). Single exponential fitting of the averaged traces revealed comparable time constants (τ) for the release of Doc2-GFP from plasma membrane, back to cytosol, following augmentation (τ = 8.65 ± 0.22 s; E) and PTP (τ = 7.45 ± 0.33 s, F).

