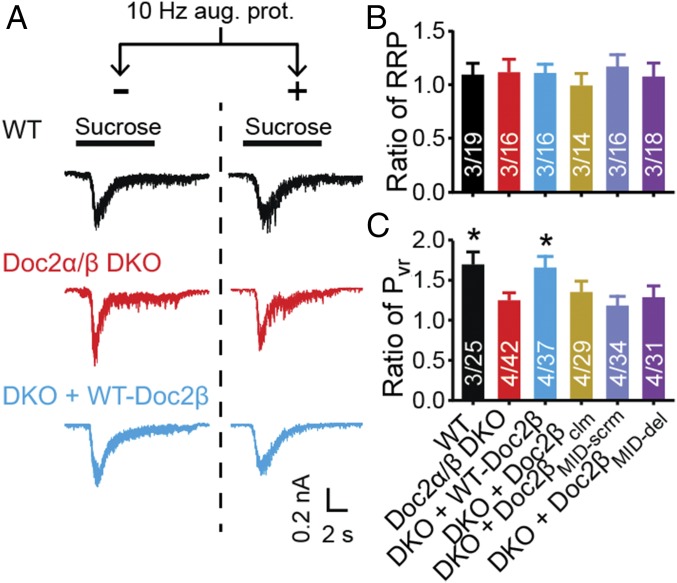
Fig. 5.
The function of Doc2 in augmentation does not involve changes in the size of the RRP. (A) Representative EPSCs, in response to local perfusion with 500 mM sucrose (black bars). (B) RRP size was evaluated by integrating the EPSC charge transfer in response to hypertonic sucrose. The RRP ratio was calculated by dividing RRP values obtained with and without augmentation. No significant differences were detected among each group (Kruskal–Wallis test). (C) Pvr was calculated by normalizing the total charge of evoked EPSCs (Fig. 1) to the RRP. The Pvr ratio (Pvr after augmentation/Pvr before augmentation) was plotted as mean ± SEM, *P < 0.05 versus Doc2α/β DKO, Kruskal–Wallis test followed by Dunn’s post hoc test. The original data are provided in SI Appendix, Fig. S9.

