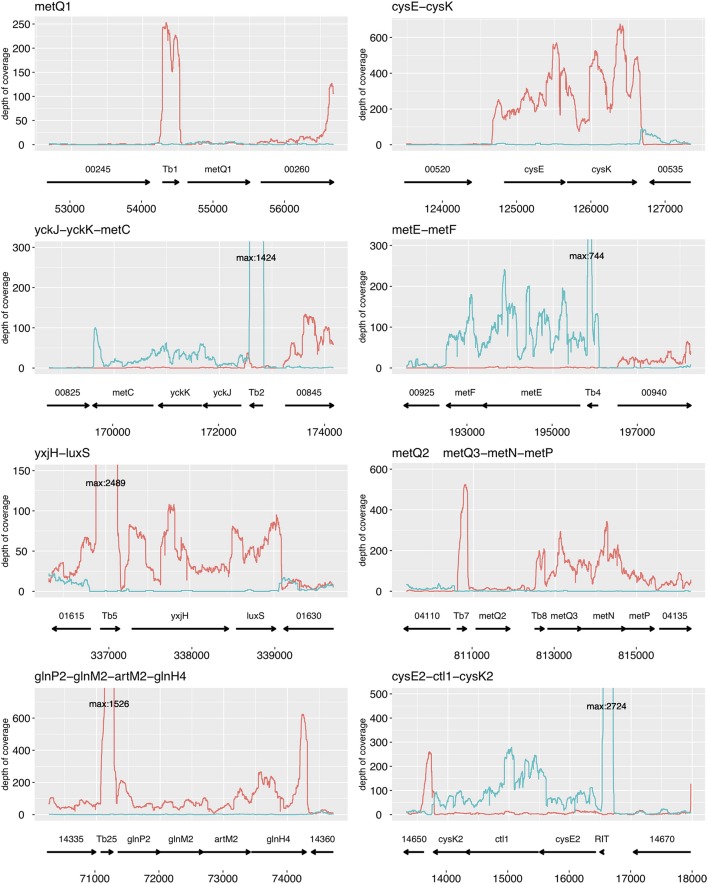
Figure 3.
Identification of operons that are involved in cysteine/ methionine biosynthesis and transport in L. paracasei FAM18149. The plots illustrate the sequence coverage per base obtained from six RNA-seq datasets. The orientation of the sequence reads is represented in red (forward) and blue (reverse). The arrows represent genes and T-boxes. The numbers below the arrows indicate the genomic position.

