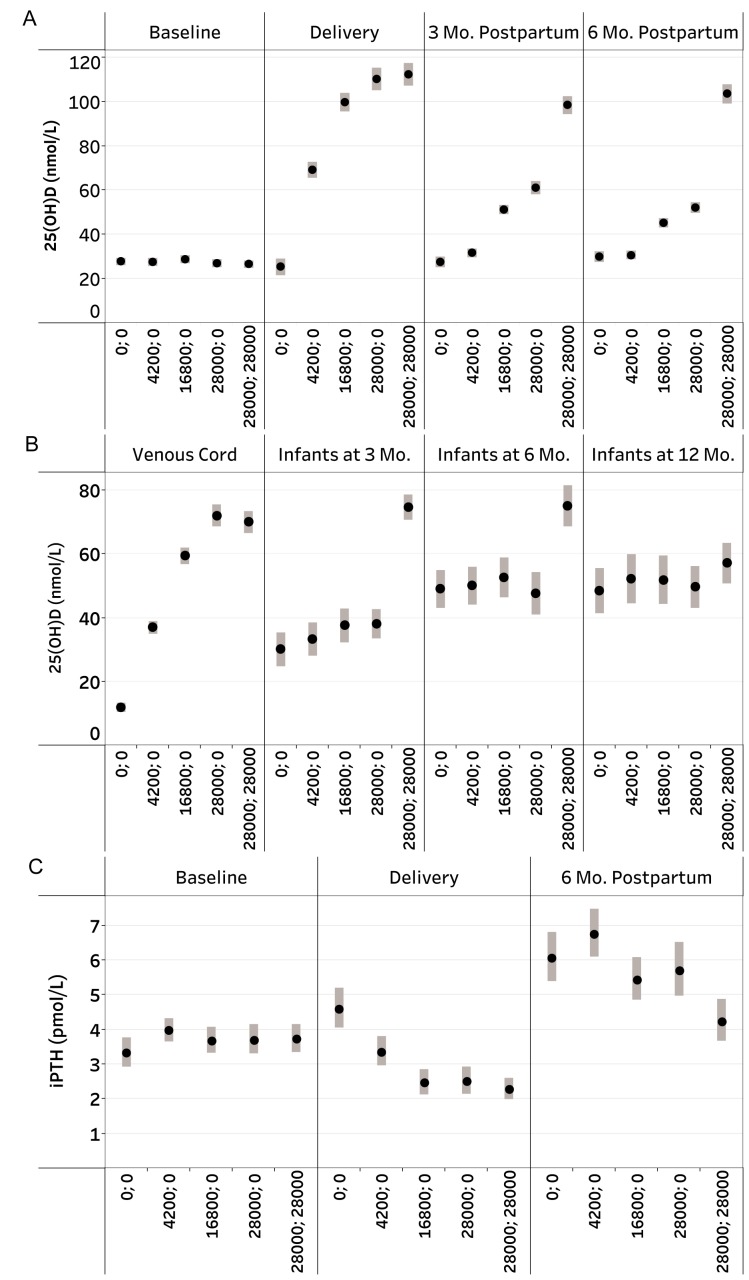
Figure 2: Study design and CONSORT diagram.
Maternal, venous cord, and infant 25-hydroxyvitamin D (25(OH)D) [nmol/L], and maternal iPTH [pmol/L] concentrations, by vitamin D supplementation group. (A) Mean maternal 25(OH)D at baseline (n=1285), delivery (n=656; delivery specimens were collected within -19 days to 11 days of delivery [median: 0 days]), 3 months postpartum (n=581), and 6 months postpartum (n=590). Bars denote 95% confidence intervals (CI); (B) Mean 25(OH)D concentrations in venous cord (n=507), infants at 3 months (n=345), infants at 6 months (n=254), and infants at 12 months (n=182). Bars denote 95% CI; (C) Geometric means of maternal iPTH concentrations [pmol/L] at baseline (n=608), delivery (n=551; delivery specimens were collected within -19 days to 11 days of delivery [median: 0 days]), and 6 months postpartum (n=588). Bars denote 95% CI.

