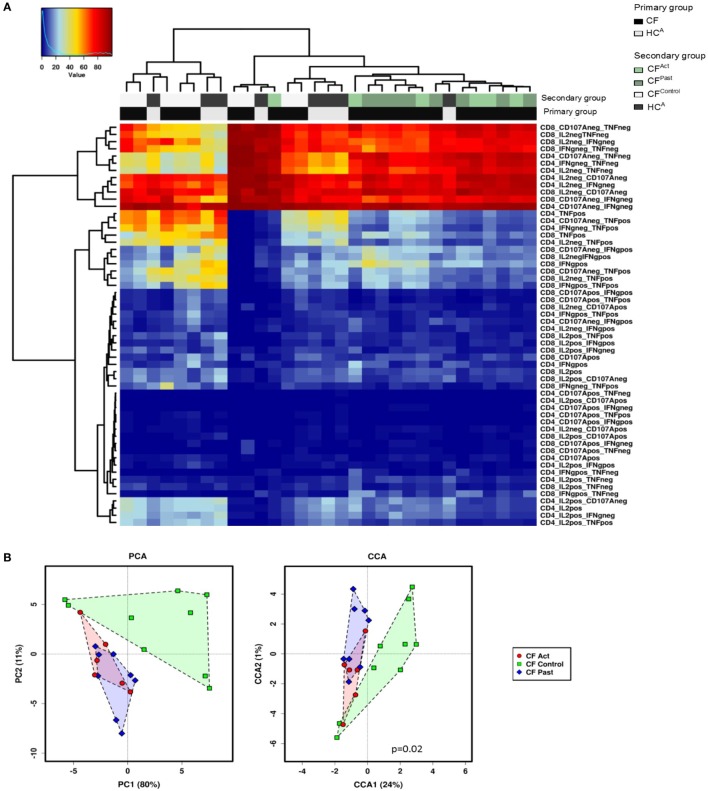
Figure 3.
Multivariate T cell analysis of mitogen-stimulated cytokine secretion profiles. (A) Unsupervised hierarchical clustering of mitogen-stimulated CD4+ and CD8+ T cell cytokine secretion profile show divergence based on non-tuberculous mycobacteria infection status. Each column represents an individual (patient/control) and each row represents a clustering variable (cytokine secretion pattern). Clustering patterns shown according to primary group [patient with cystic fibrosis (CF) black, or healthy control gray] and secondary group (CFAct-light green, CFPast-dark green, CFContro1-white, and HCA-black). Clustering of CFAc and CFPast patients with one exception and clustering of CFContro1 and HCA with one exception. (B) Principle component analysis (PCA) and canonical co-variate analysis (CCA) show significant clustering (P = 0.02) of subjects by patient group. Marked overlap between CFAct and CFPast groups is seen in terms of global cytokine secretion profile indicating an overall similarity in secretion profile. CFContro1 group diverges further from CFAct and CFPast groups.

