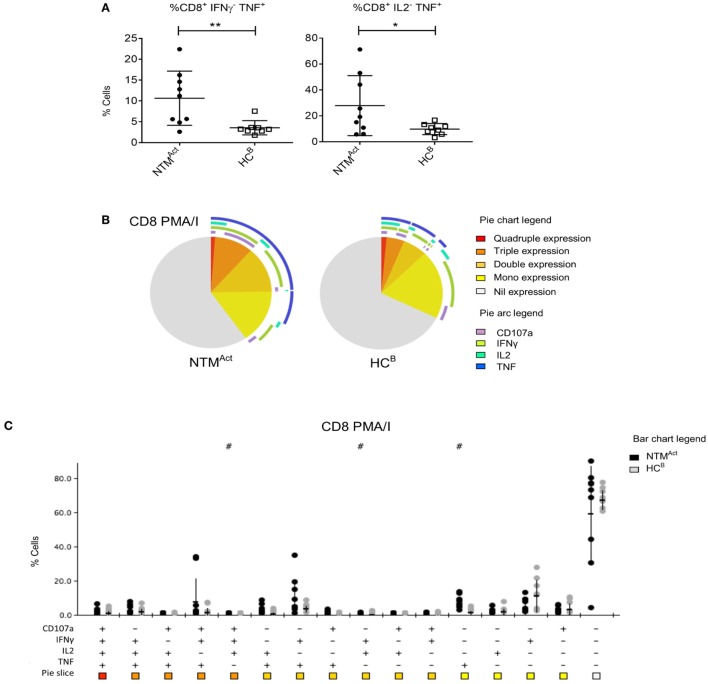
Figure 6.
Divergence of CD8+ T cell cytokine profiles in immunocompetent individuals with active non-tuberculous mycobacteria (NTM) infection. (A) Flow cytometric analysis of ex vivo CD8+ T cells showed significantly more IFNγ− TNFα+ cells (P = 0.01) and IL2− TNFα+ cells (P = 0.048) in NTMAct compared to HCB. (B) Polyfunctionality profiling of CD8+ T cells shown in pie charts were not significantly different between the two groups. However, significantly higher TNFα mono-functional CD8+ T cells were observed in NTM patient group (P = 0.002). (C) SPICE dot plots show polyfunctionality profile of all combinations of cytokine expression in CD8+ T cells after PMA/I stimulation between NTMAct and HCB groups. Significantly different expression compared to HCB (Wilcoxon rank test P < 0.05) is indicated with # symbol.

