
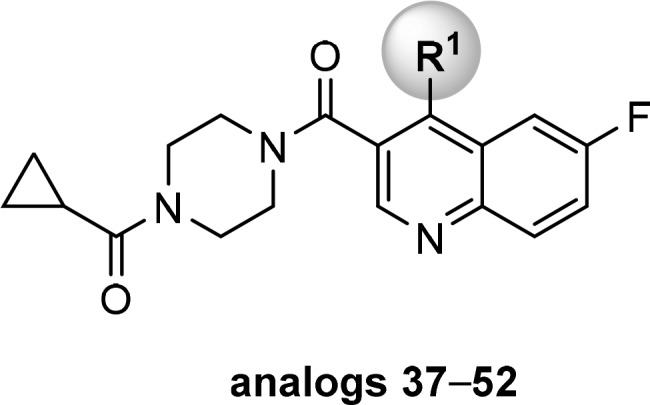
Table 2. SAR of R1 Substitution of Quinoline Core.

a
Values with standard deviation (SD) represent the average from at least three experiments.
b
RLM represents rat liver microsomal stability conducted at NCATS in the presence of NADPH.
c
Compounds noted as >57 μM represent a very weak or no inhibition [efficacy of ≤50% of full inhibition at highest tested concentration (57 μM)].