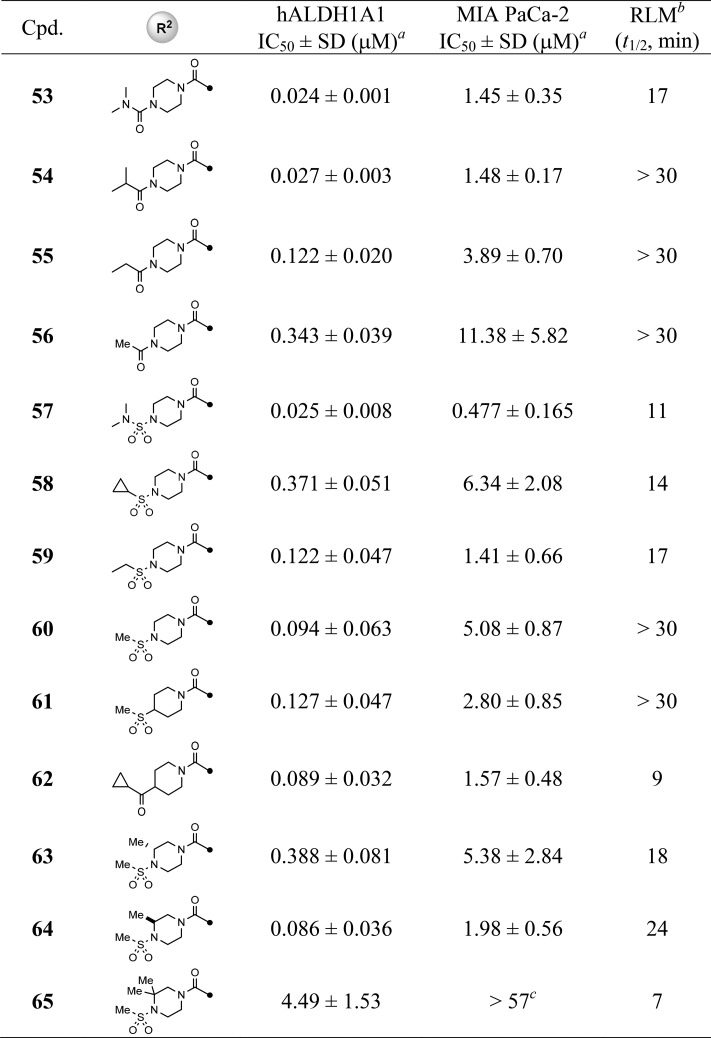
Table 3. SAR of R2 Substitution of Quinoline Core.

Values with standard deviation (SD) represent the average from at least three experiments.
RLM represents rat liver microsomal stability conducted at NCATS in the presence of NADPH.
Compounds noted as >57 μM represent a very weak or no inhibition [efficacy of ≤50% of full inhibition at highest tested concentration (57 μM)].

