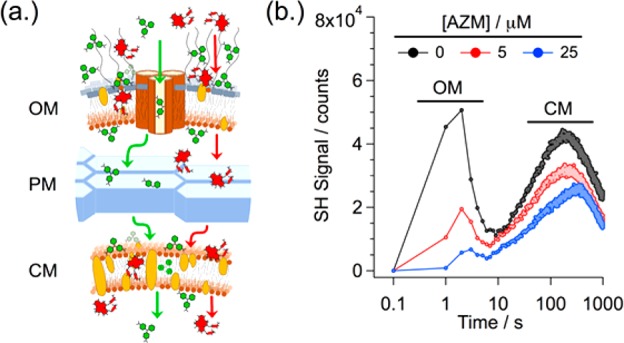
Figure 1.

(a) Cartoon schematic of adsorption/transport of MG (green) and AZM (red) with respect to the ultrastructure of Gram-negative bacteria. (b) Time-resolved SHS signal, plotted in log time, monitoring uptake of MG by E. coli in increasing concentrations of AZM. SHS intensities are in units of photon counts.
