
Figure 5.
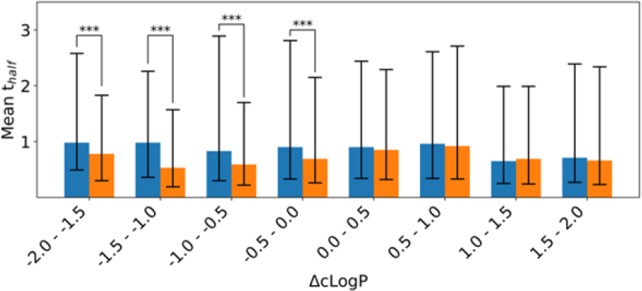
Bar charts that highlight the relationship between the change in half-life and change in cLogP upon replacement of a hydrogen atom with a substituent. Blue bars correspond to hydrogen analogs, and orange bars correspond to substituted analogs. Lines represent the range of one standard deviation, and statistically significant changes are highlighted.