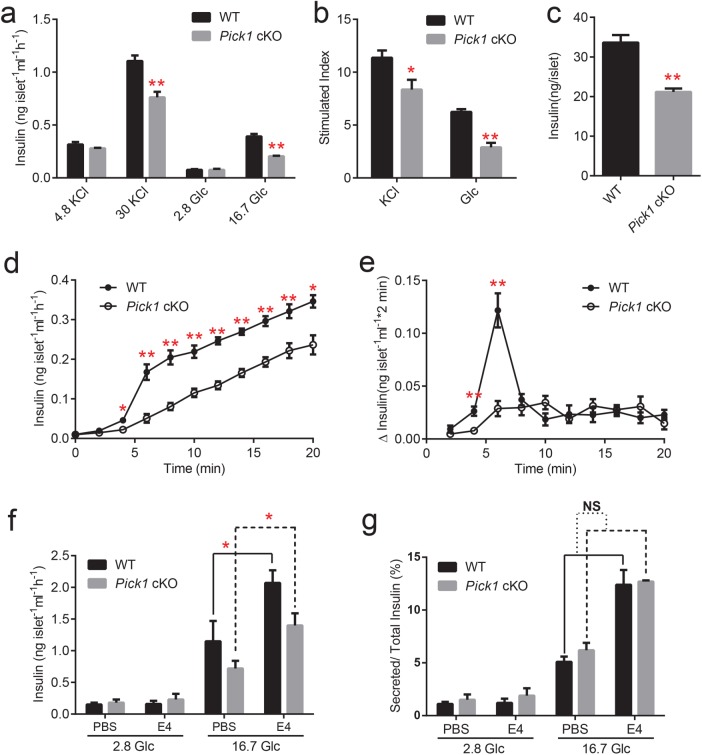
FIGURE 2:
Impaired insulin secretion from isolated Pick1 cKO islets. (a) GSIS was performed on isolated islets stimulated with 4.8 or 30 mM KCl or 2.8 or 16.7 mM glucose (Glc). (b) The stimulated index was also calculated following KCl or Glc treatment. (c) Insulin content in the isolated islets was measured by ELISA. (d) Isolated WT and Pick1 cKO islets were incubated in the presence of 16.7 mM Glc at 2-min intervals for 20 min. (e) Same data as shown in d, but plotted as release per 2 min. (f, g) Secreted insulin was tested from isolated WT and Pick1 cKO islets incubated with or without E4. Data are represented as mean ± SEM, n = 3, three to four groups per type of mouse, 10–0 islets per group. *p < 0.05, **p < 0.01; two-sided Student’s t test.

