FIGURE 3:
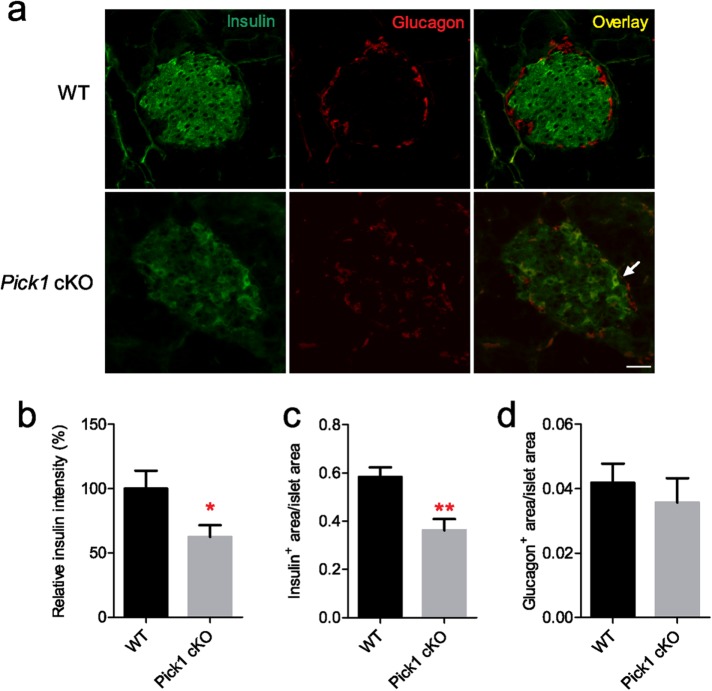
Disrupted pancreatic beta cells in Pick1 cKO islets. (a) Representative insulin and glucagon immunostaining images of pancreas from WT and Pick1 cKO mice. Scale bar, 50 μm. Arrow indicates insulin and glucagon dual-positive cells. (b) Quantification of relative insulin intensity. (c, d) Quantification of insulin-positive area/islet area and glucagon-positive area/islet area from WT and Pick1 cKO mice, n = 6; 50–60 islets were calculated from each genotype. Data are represented as mean ± SEM. *p < 0.05, **p < 0.01; two-sided Student’s t test.

