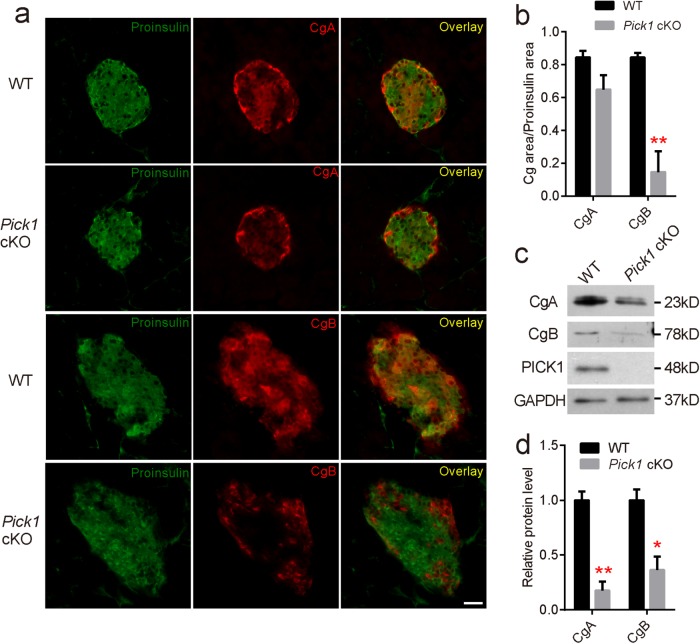
FIGURE 5:
Dramatic decrease in CgB in pancreatic beta cells from Pick1 cKO mice. (a) Pancreatic sections from 5-mo-old mice of the indicated genotypes were stained with antibodies against proinsulin (green) and CgA (red) or proinsulin (green) and CgB (red). Scale bar represents 50 μm. (b) Quantification analysis of the Cg/proinsulin area. n = 3. 25 islets were calculated per genotype. (c) Western blot analysis of CgA and CgB in isolated islets from WT and Pick1 cKO mice. (d) Quantification of CgA and CgB in isolated islets from WT and Pick1 cKO mice. Data are represented as mean ± SEM. *p < 0.05, **p < 0.01; two-sided Student’s t test.

