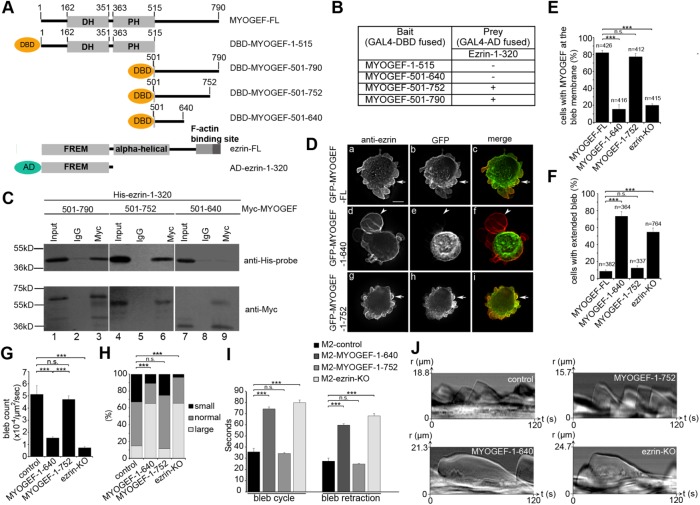
FIGURE 3:
The ezrin–MYOGEF interaction is critical for bleb retraction. (A) Schematic showing different truncated versions of MYOGEF and ezrin fragments used in yeast two-hybrid assays. AD, activation domain of GAL4; DBD, DNA-binding domain of GAL4. (B, C) Yeast two-hybrid (B) and coimmunoprecipitation (C) assays indicating that amino acid residues 640–752 in MYOGEF are required for interactions with the N-terminal region of ezrin. In B, (—) indicates that yeast cells did not grow on the selective SD agar plates (SD/-Ade-His-Leu-Trp); (+) indicates that yeast cells could grow on the selective SD agar plates (SD/-Ade-His-Leu-Trp) and that X-gal filter assays were positive. (D) The ezrin-binding region (residues 640–752) in MYOGEF is required for MYOGEF localization at the bleb membrane. GFP-MYOGEF-1–640 (lacking the ezrin-binding region) was not colocalized with ezrin at the bleb membrane in transfected M2 melanoma cells (arrowheads in panels d–f), while GFP-MYOGEF-FL or GFP-MYOGEF-1–752 (containing the ezrin-binding region) was colocalized with ezrin at the bleb membrane (arrows in panels a–c and g–i). Bar, 10 μm. (E) Percentage of cells with MYOGEF at the bleb membrane was quantified. Note that lack of the ezrin-binding region or knockout of ezrin impaired the localization of MYOGEF to the bleb membrane. Statistical significance was determined using one-way ANOVA test and Tukey’s post hoc test. n.s., nonsignificant (p ≥ 0.05); ***, p < 0.001. Data are mean ± SD. (F) Percentage of cells with extended blebs was quantified in control M2 melanoma cells expressing GFP-MYOGEF-FL, GFP-MYOGEF-1–640, or GFP-MYOGEF-1–752, as well as in ezrin-KO M2 cells expressing GFP-MYOGFEF-FL. Note that extended blebs were formed in M2 melanoma cells expressing GFP-MYOGEF-1–640 and in ezrin-KO cells. Statistical significance was determined using a one-way ANOVA test and Tukey’s post hoc test. ***, p < 0.001. Data are mean ± SD. (G) Quantification of bleb number in a cell. All blebs in each cell examined were counted in a 2-min period. Three independent experiments were done and 30 cells were analyzed for each experiment. The bleb number was normalized to the cell area (μm2) and to time (s). Statistical significance was determined using one-way ANOVA and Tukey’s post hoc test. ***, p < 0.001. Data are mean ± SD. (H) Distributions of bleb size in a cell were compared using a chi-squared test. ***, p < 0.001. (I) The time required for blebs to complete a bleb cycle or bleb retraction. Statistical significance was determined using one-way ANOVA and Tukey’s post hoc test. ***, p < 0.001. Data are mean ± SD. (J) Representative kymographs demonstrating the efficiency of bleb cycling and bleb retraction. Kymographs were created from DIC images.

