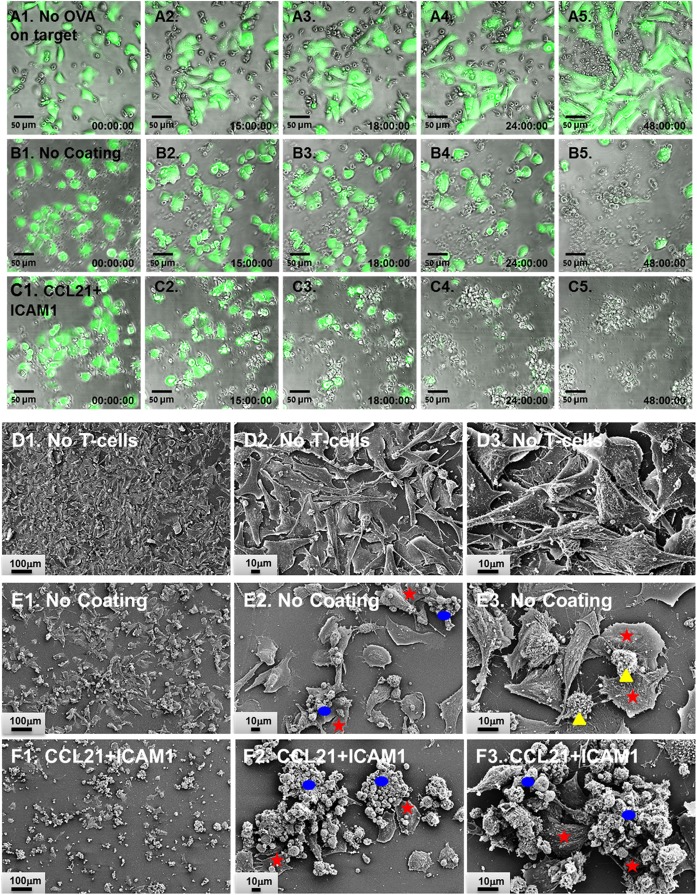
Figure 5.
CD8+ T-cells pre-cultured on substrate-immobilized CCL21 + intercellular adhesion molecule 1 (ICAM1) kill target cells more rapidly. (A1–C5) Representative overlays of time-lapse phase contrast and florescence imaging. OT-I CD8+ T-cells (unstained) were pre-cultured for 7 days prior to co-culturing with target cells, on either an uncoated substrate (A1–A5,B1–B5) or on substrate-immobilized CCL21 + ICAM1 (C1–C5). T-cells were then co-cultured with either B16-GFP cells (A1–A5) or B16-ovalbumin-GFP cells (B1–C5). Live target cells are shown in green. B16-GFP cells, which do not express ovalbumin, were not killed by OT-I T-cells (A1–A5). Substrate-immobilized CCL21 + ICAM1 induced faster killing of B16-ovalbumin-GFP cells (C1–C5), compared to OT-I T-cells pre-cultured on uncoated substrates (B1–B5). Time stamp: hh:mm:ss. Scale bar: 50 µm. (D1–F3) Representative scanning electron micrographs of B16-ovalbumin-GFP cells (large cells spread on the substrate), cultured alone (D1–D3), or co-cultured for 16 h with OT-I T-cells pre-cultured for 7 days on either an uncoated substrate (E1–E3), or on substrate-immobilized CCL21 + ICAM1 (F1–F3). T-cells grown on substrate-immobilized CCL21 + ICAM1 (F1–F3) killed more target cells, as demonstrated by the lower number of remaining B16 cells. Representative target cells are denoted with red stars. Representative T-cell clusters are denoted with blue ellipsoids. Representative isolated T-cells are denoted with yellow triangles. Scale bar: In E1, F1—100 µm; in E2, E3, F2, and F3—10 µm.

