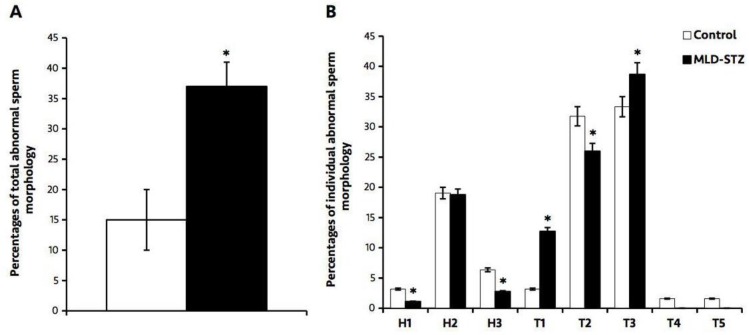
Figure 4.
The percentages of the total (A) and individual abnormal sperm morphology compared between the control and MLD-STZ groups. Head abnormalities: H1, thin-elongated head; H2, club-shaped head; H3, mild head defects. Tail abnormalities: T1, bent head; T2, looping mid- piece; T3, folded mid- and principal piece; T4, incorrect head-neck connection; T5, lasso-like.. Data point represented as mean±S.D. (n=5each group). *p<0.05

