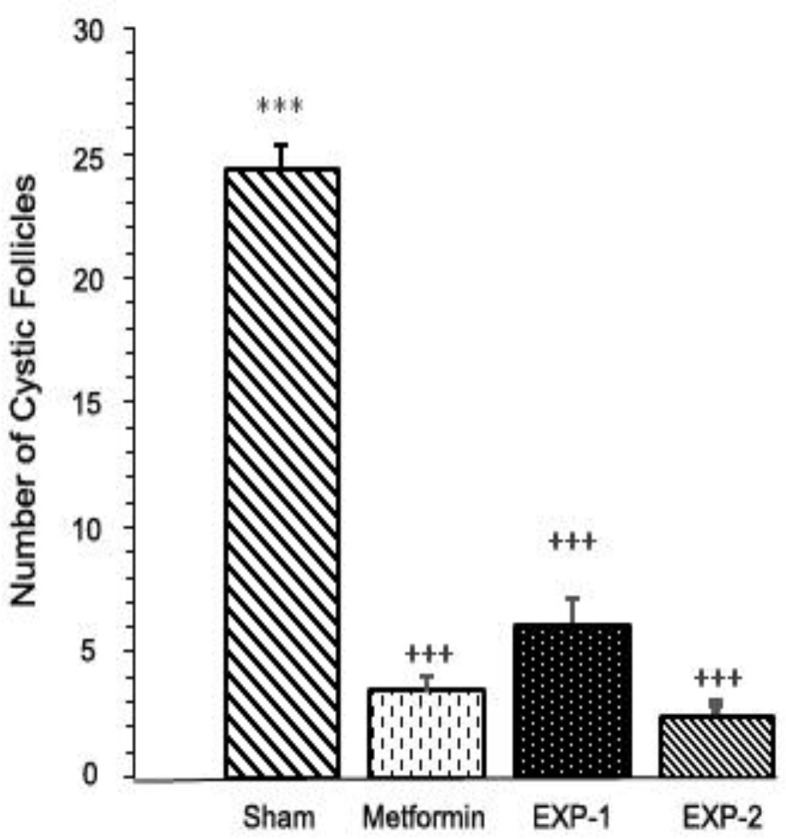
Figure 3.

Number of cystic follicles in sham, metformin, EXP-1, and EXP-2 rats after 8 wk of the experimental period. Values are presented as mean±SE. (n=6/each group). *** Statistically different from the control rats (p≤0.001), +++ statistically different from the sham rats (p≤0.001
