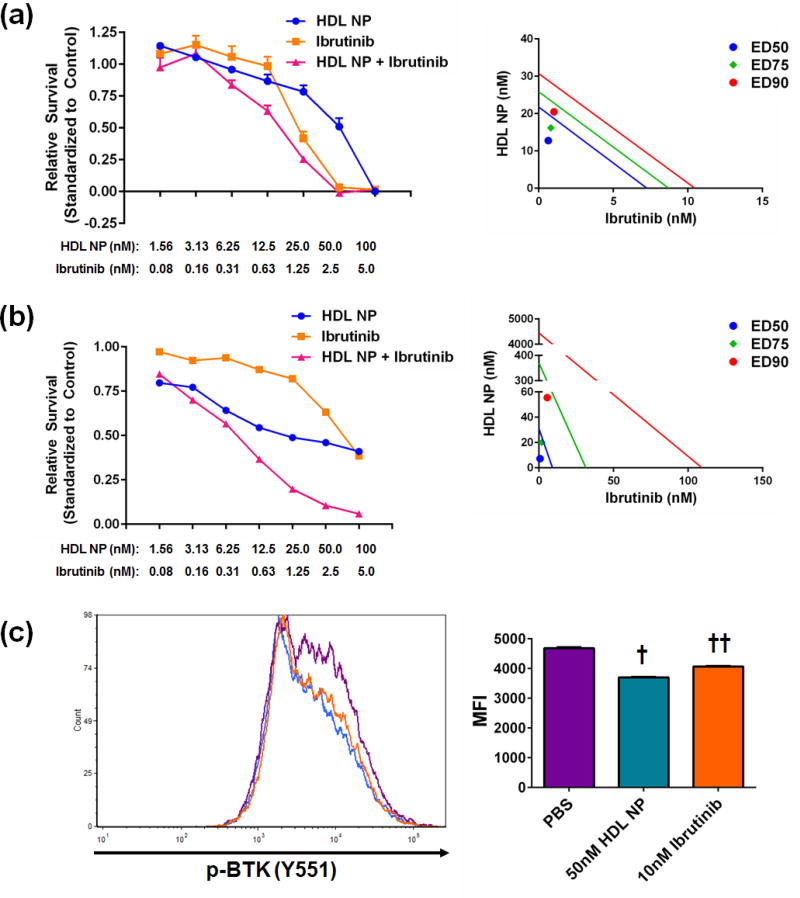
Figure 3. HDL NPs synergize with the BTK inhibitor Ibrutinib.
A. HDL NPs synergized with the BTK inhibitor Ibrutinib in TMD8 (a) and HBL-1 (b) cells. Left- dose response curves. Right- Isobolographs depicting synergy at the ED50 (blue), ED75 (green), and ED90 levels (red). (c) Phos-flow analysis of TMD8 cells treated with HDL NPs or Ibrutinib. Cells were treated for 2 hours prior to analysis. † p<0.0001 v. all other groups by 1-way ANOVA. †† p<0.0001 v. all other groups by 1-way ANOVA. Data presented as mean ± s.e.m.

