
Figure 2.
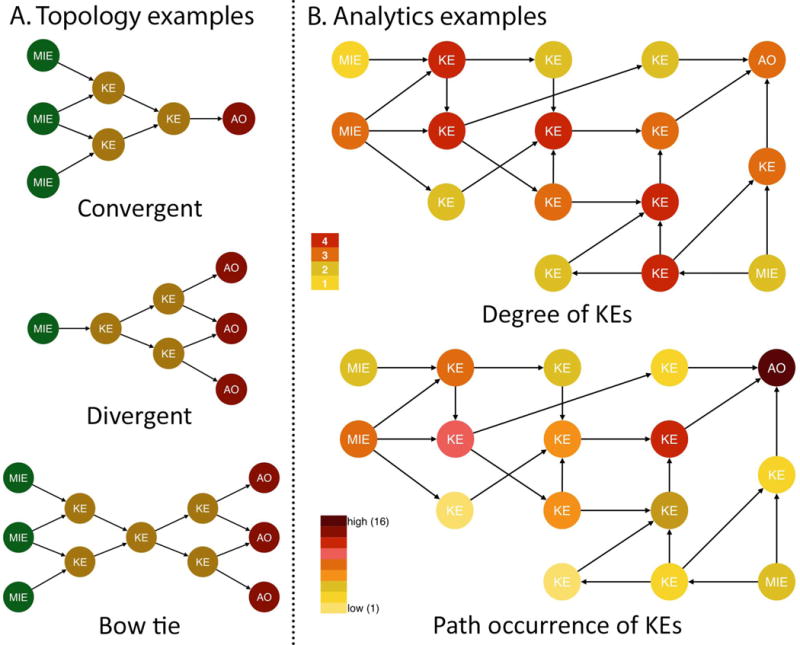
Examples of AOP network analysis concepts and approaches. (A) Network topology analysis can reveal converging, diverging, or mixed patterns. A mixed pattern can take the shape of a bow tie motif. (B) Two different examples of network metrics calculated for the same hypothetical AOP network. The degree of a node (key event, KE) in the network is equal to the number of edges (key event relationships, KERs) connecting the node to the network and is one way of expressing how connected that node is to the network. The path occurrence is the number of times a node (KE) occurs in a path connecting a molecular initiation event (MIE) to an adverse outcome (AO) after evaluating all possible paths between the MIEs and AOs of the network. The path occurrence may be an indication of the relative importance of a node within the overall network.