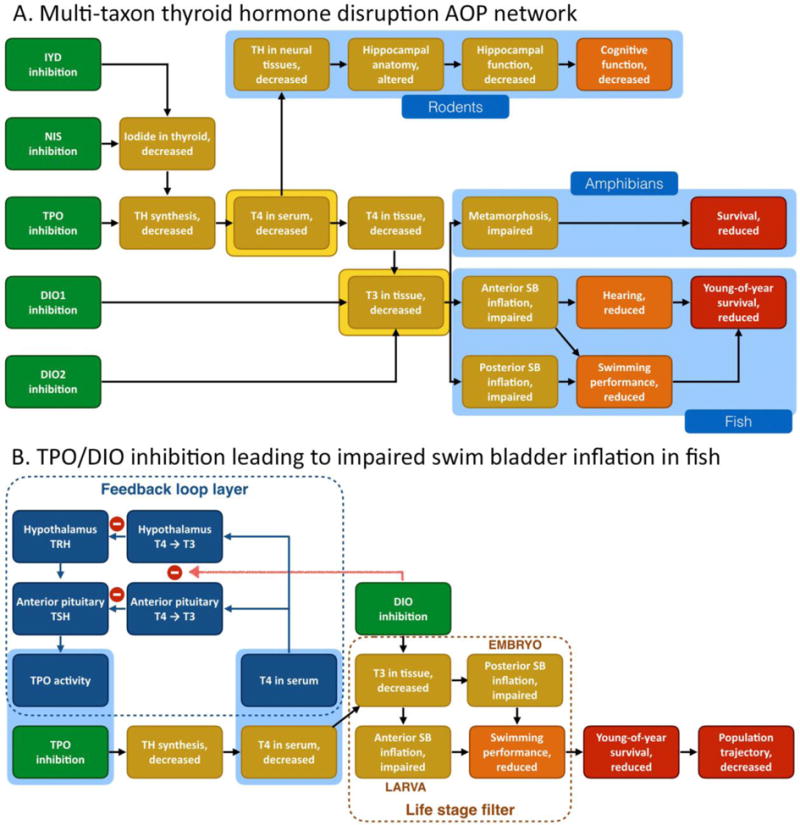
Figure 4.

AOP networks related to disruption of the thyroid axis. (A) Multi-taxon thyroid hormone disruption AOP network including mammalian, amphibian and teleost endpoints. The blue regions illustrate how a taxonomic applicability layer may be used to add relevant data to the primary network representation. The key events highlighted in yellow indicate two major points of convergence/divergence in the network, resembling the “knot” of a bow tie motif. (B) Filtered thyroid AOP network only containing key events that are relevant to fish. The dashed brown area illustrates how additional filtering might be used to further refine the network, e.g. to only include key events that are relevant to specific life stages. The blue area illustrates the use of a layer to indicate the presence of a feedback loop acting on an AOP in the network, and the interaction between the feedback loop and one of the molecular initiating events in the network. IYD: iodotyrosine deiodinase, NIS: sodium-iodide symporter, TPO: thyroperoxidase, DIO: iodothyronine deiodinase, TH: thyroid hormone, T4: thyroxine, T3: triiodothyronine, TRH: thyrotropin-releasing hormone, TSH: thyroid stimulating hormone, thyrotropin, SB: swim bladder. Red negative sign: inhibition processes. Red arrow: DIO inhibition decreases conversion of T4 into T3, thereby inhibiting the feedback inhibition of T3 on TRH and TSH synthesis.
