
Figure 2.
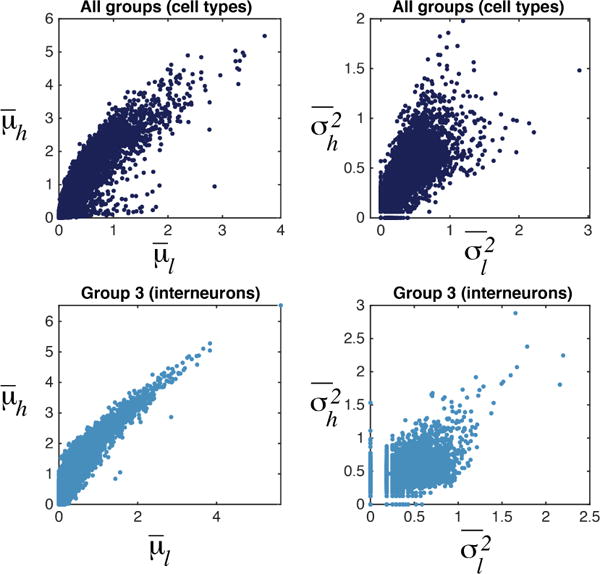
Top: Means and variances per gene across a window of cells with high library size vs a window of cells with low library size (each data point is one gene). Bottom: Same for a particular cluster (cell type): interneurons.
Official websites use .gov
A
.gov website belongs to an official
government organization in the United States.
Secure .gov websites use HTTPS
A lock (
) or https:// means you've safely
connected to the .gov website. Share sensitive
information only on official, secure websites.
Top: Means and variances per gene across a window of cells with high library size vs a window of cells with low library size (each data point is one gene). Bottom: Same for a particular cluster (cell type): interneurons.