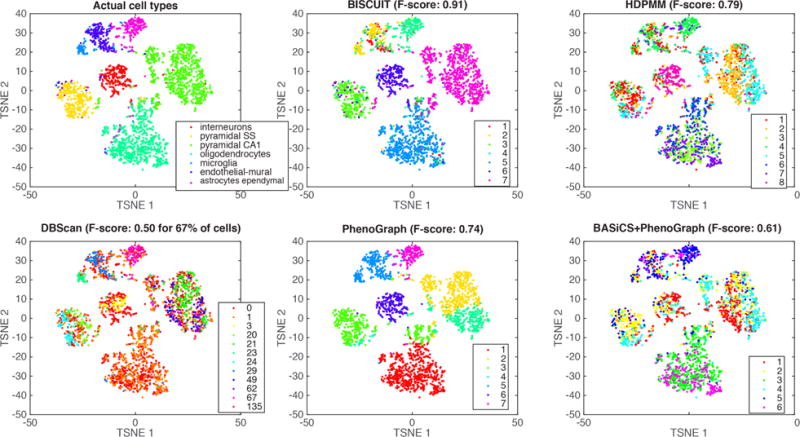
Figure 8.

Actual cell types (top left) compared to mode of inferred classes using BISCUIT (top center) versus other comparative approaches for 3005 cells in the (Zeisel et al., 2015) dataset. Cells are projected to 2D using t-SNE (Van der Maaten & Hinton, 2008).
