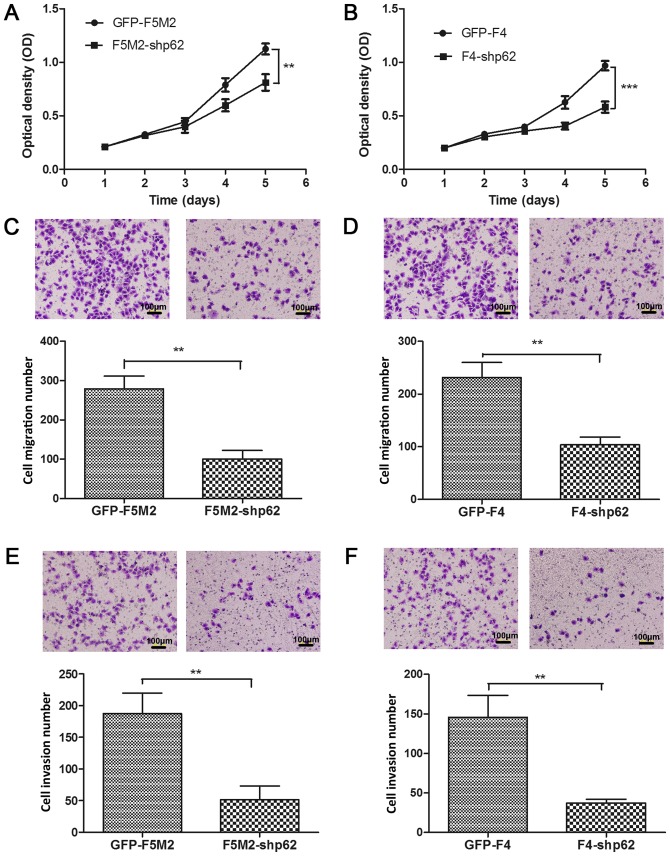
Figure 3.
Suppressing p62 expression inhibited proliferation, migration, and invasion. (A) CCK-8 assay for the GFP-F5M2 and F5M2-shp62 cells. The proliferation rate of the F5M2-shp62 cells was significantly decreased compared with that of the GFP-F5M2 cells. (B) CCK-8 assay for the GFP-F4 and F4-shp62 cells. The proliferation rate of the F4-shp62 cells was significantly decreased compared with that of the GFP-F4 cells. (C) Migration assay with GFP-F5M2 and F5M2-shp62 cells. The migratory capacity of the F5M2-shp62 cells was significantly decreased compared with that of the GFP-F5M2 cells. (D) Migration assay with GFP-F4 and F4-shp62 cells. The migratory capacity of the F4-shp62 cells was significantly decreased compared with that of the GFP-F4 cells. (E) Invasion assay with GFP-F5M2 and F5M2-shp62 cells. The invasion rate of the F5M2-shp62 cells was significantly decreased compared with that of the GFP-F5M2 cells. (F) Invasion assay with GFP-F4 and F4-shp62 cells. The invasion rate of the F4-shp62 cells was significantly decreased compared with that of the GFP-F4 cells (vs. F4-shp62). Data are presented as the mean ± standard deviation of three independent experiments. **P<0.01; ***P<0.001. CCK-8, Cell Counting kit-8; sh, short hairpin.

