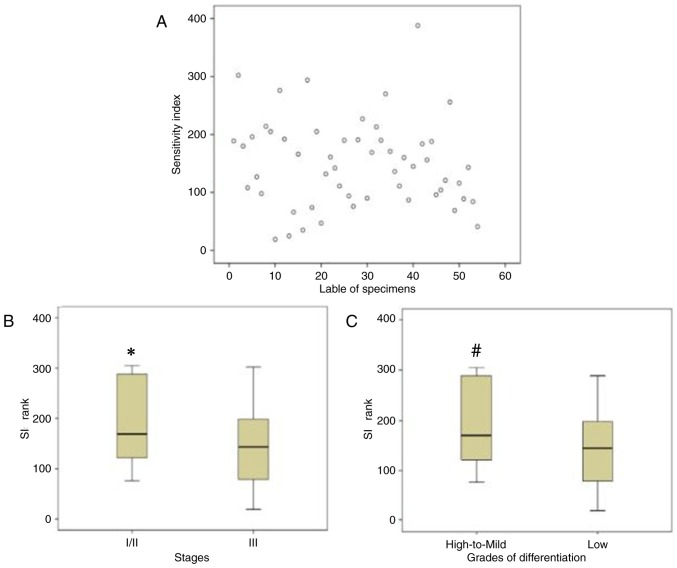
Figure 1.
Results of in vitro adenosine triphosphate-tumor chemosensitivity assays. (A) Scatter plots demonstrating heterogeneity of paclitaxel in various tumor samples. Box-and-whisker plots of the SI rank of paclitaxel in specimens with different (B) stages or (C) grades of differentiation. The bottom and top edges of the boxes represent the 25th and 75th percentiles, respectively, whereas the horizontal line corresponds to the median value. The vertical lines show the range of values. *P<0.05 vs. advanced-stage (III) specimens, #P<0.05 vs. low differentiation. SI, sensitivity index.

