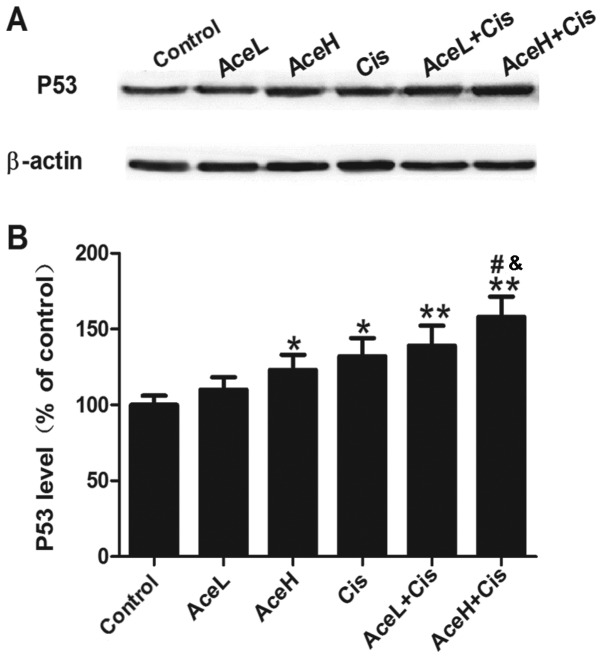
Figure 2.
Effects of Ace and/or Cis treatment on P53 expression in Hep-2 cells. (A) Representative images from western blot analysis of the protein expression levels of P53 in Hep-2 cells. β-actin was used as a housekeeping control. (B) Quantification of P53 protein expression levels following different drug treatments for 48 h. Data were expressed as mean ± standard deviation. *P<0.05 and **P<0.01 compared with control group; #P<0.05 compared with Cis group; &P<0.05 compared with AceH group. Ace, acetazolamide; Cis, cisplatin; P53, tumor protein p53; L, low dose 1×10⁻⁸ mol/l; H, high dose 5×10⁻⁸ mol/l.

