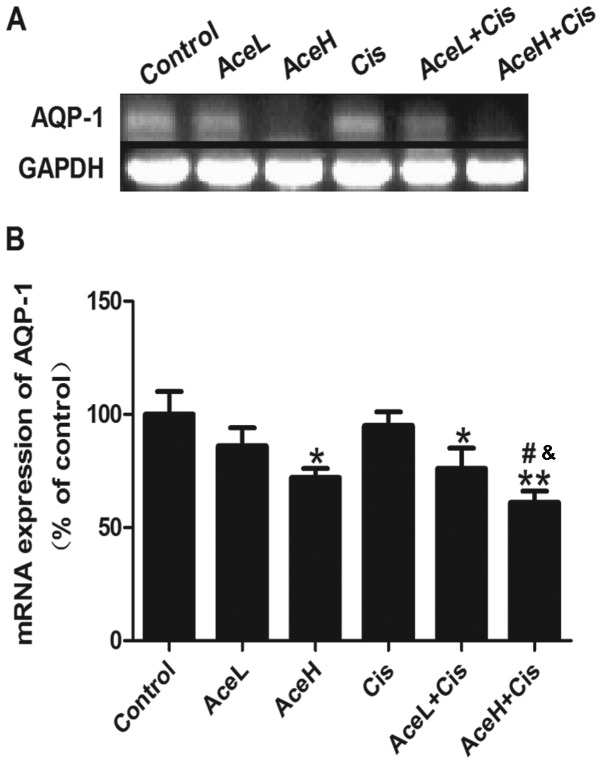
Figure 6.
Effects of Ace and/or Cis treatment on the mRNA expression of AQP1 in Hep-2 cells. (A) Representative electrophoretic patterns of PCR products following the indicated drug treatments. GAPDH was used as the loading control. (B) Quantification of AQP1 mRNA expression levels following the indicated drug treatments. Data expressed as mean ± standard deviation. *P<0.05 and **P<0.01 compared with control group; #P<0.05 compared with Cis group; &P<0.05 compared with AceH group. Ace, acetazolamide; Cis, cisplatin; AQP1, aquaporin-1; L, low dose 1×10⁻⁸ mol/l; H, high dose 5×10⁻⁸ mol/l.

