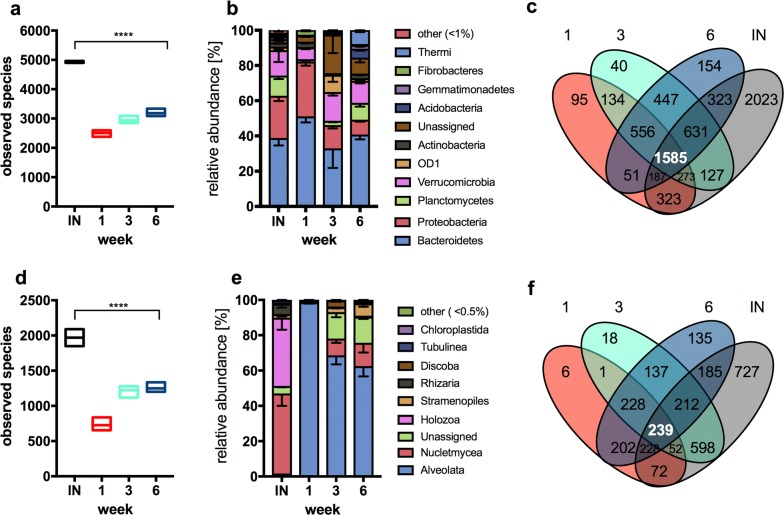
Fig. 2.
Taxonomic distribution of bacterial and eukaryotic community obtained by rRNA amplicon sequencing. a and d Number of observed species in wheat straw compost inoculum (IN) and compost-derived samples collected at week 1, 3 and 6. Floating bars represent minimum, mean and maximum number of detected OTUs. Ordinary one-way ANOVA test was performed to show significant differences in bacterial [a, F(3, 7) = 174, p < 0.0001] and eukaryotic [d, F(3, 7) = 57.11, p < 0.0001] richness between samples. b and e Relative abundance of the bacterial phyla and highest eukaryotic rank in inoculum (IN) and samples collected at week 1, 3 and 6. Error bars represent s.e.m, n = 3. c and f Venn diagrams represent number of shared and unique bacterial (c) and eukaryotic (f) OTUs between wheat straw compost inoculum (IN) and weekly samples (week 1, 3 and 6)

