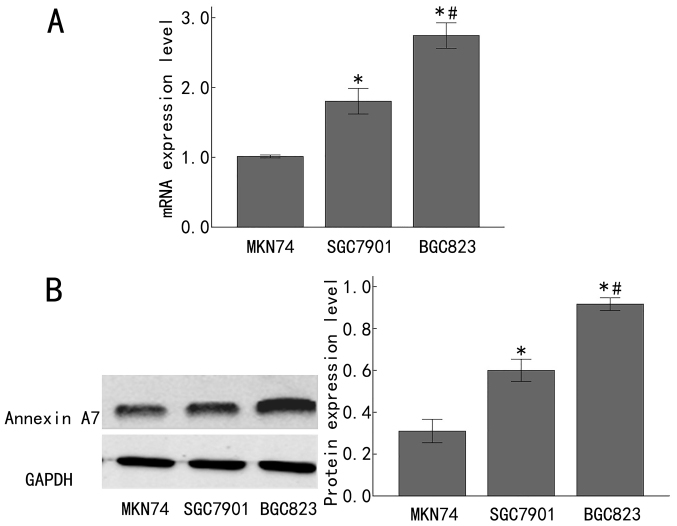
Figure 2.
Expression of Annexin A7 in differently differentiated gastric cancer cell lines. (A) The expression of Annexin A7 mRNA was measured by fluorescence reverse transcription-quantitative polymerase chain reaction in differently differentiated gastric cancer cell lines. (B) The Annexin A7 protein levels in differently differentiated gastric cancer cell lines were determined by western blot analysis, with GAPDH as the loading control. Left, representative western blots and right, integrated optical density values of the western blot results. *P<0.05 compared with the MKN74 cells; #P<0.05 compared with the SGC7901 cells.

