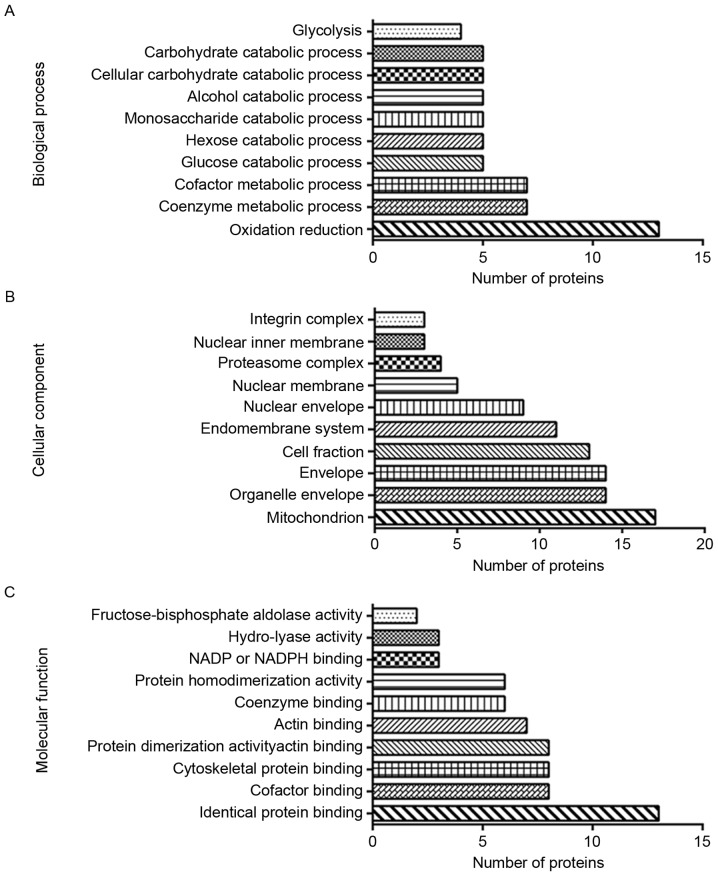
Figure 4.
The 84 differentially expressed proteins were uploaded to the Database for Annotation, Visualization and Integrated Discovery for GO analysis. The histograms demonstrate the top 10 terms by count for (A) biological process, (B) cellular component and (C) molecular function. GO, Gene Ontology.

