Figure 4.
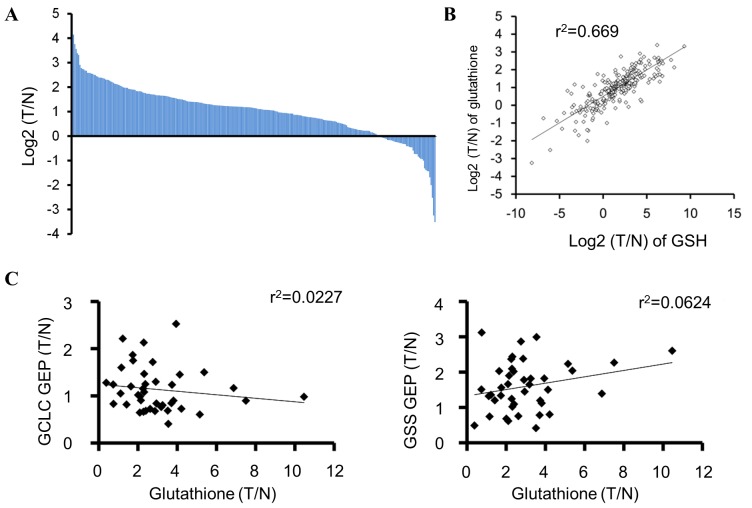
Glutathione levels in tumors of patients with colorectal cancer. (A) Waterfall plots of log2(T/N) values of total glutathione (GSH+GSSG) in tissue samples from patients with colorectal cancer. (B) Correlation between log2(T/N) values of GSH and total glutathione (GSH+GSSG) in tissue samples from patients with colorectal cancer (P=8.18×10−66), as evaluated by Pearson correlation analysis. (C) Correlation between total glutathione (GSH+GSSG) and GCLC (P=0.35) or GSS (P=0.12) mRNA levels (T/N) in tissue samples from patients with colorectal cancer, as evaluated by Pearson correlation analysis. T/N, tumor/normal tissues; GSH, glutathione (reduced form); GSSG, glutathione disulphide; GCLC, glutamate-cysteine ligase catalytic subunit; GSS, GSH synthetase; GEP, gene expression.

